Crow vs Peruvian Ambulatory Disability
COMPARE
Crow
Peruvian
Ambulatory Disability
Ambulatory Disability Comparison
Crow
Peruvians
6.9%
AMBULATORY DISABILITY
0.0/ 100
METRIC RATING
295th/ 347
METRIC RANK
5.7%
AMBULATORY DISABILITY
99.5/ 100
METRIC RATING
69th/ 347
METRIC RANK
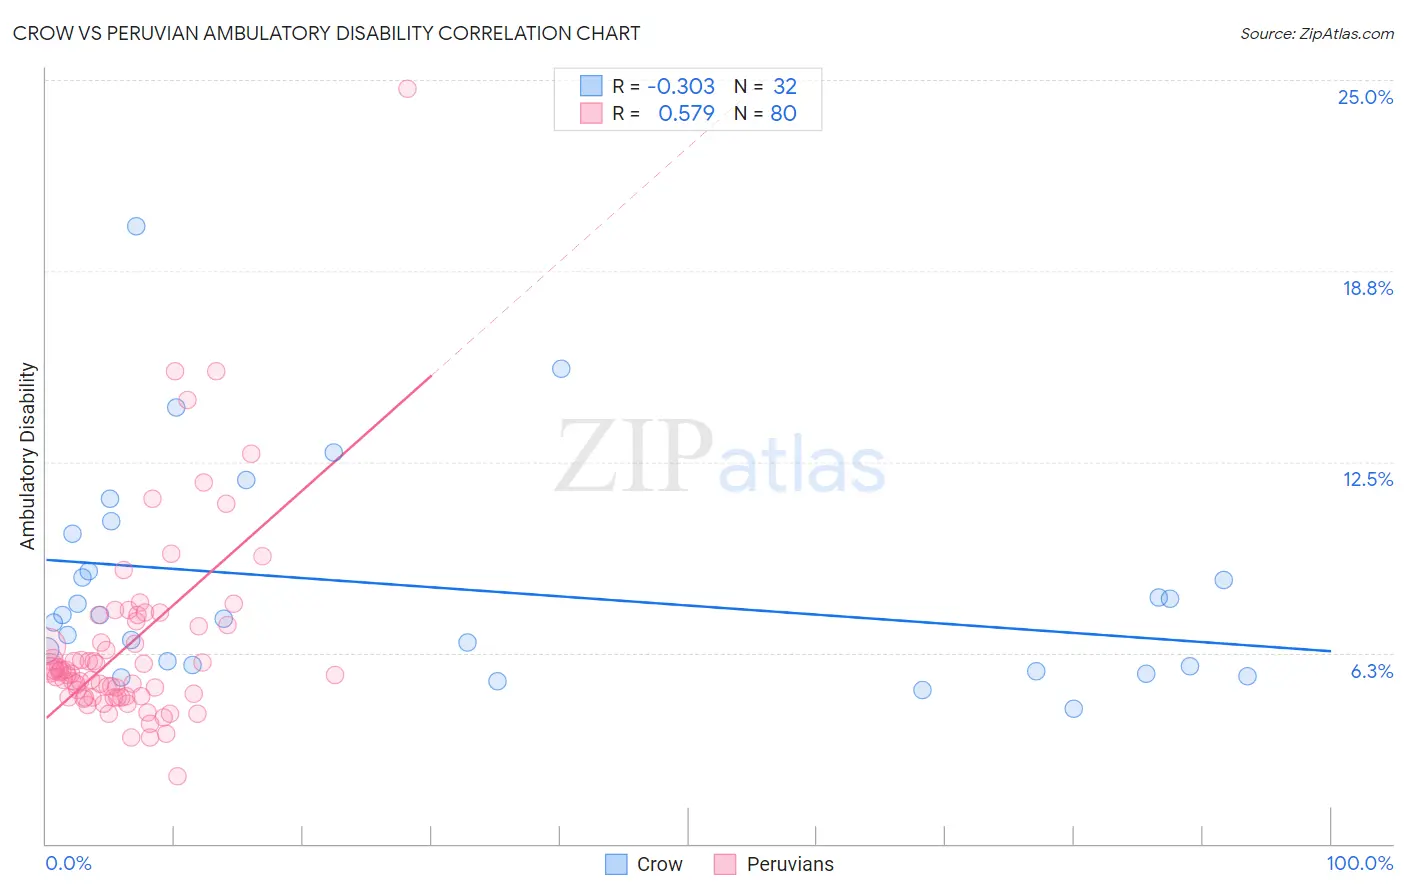
Crow vs Peruvian Ambulatory Disability Correlation Chart
The statistical analysis conducted on geographies consisting of 59,204,118 people shows a mild negative correlation between the proportion of Crow and percentage of population with ambulatory disability in the United States with a correlation coefficient (R) of -0.303 and weighted average of 6.9%. Similarly, the statistical analysis conducted on geographies consisting of 363,114,873 people shows a substantial positive correlation between the proportion of Peruvians and percentage of population with ambulatory disability in the United States with a correlation coefficient (R) of 0.579 and weighted average of 5.7%, a difference of 21.5%.
Ambulatory Disability Correlation Summary
| Measurement | Crow | Peruvian |
| Minimum | 4.4% | 2.2% |
| Maximum | 20.2% | 24.7% |
| Range | 15.8% | 22.5% |
| Mean | 8.4% | 6.6% |
| Median | 7.4% | 5.7% |
| Interquartile 25% (IQ1) | 5.8% | 4.8% |
| Interquartile 75% (IQ3) | 9.5% | 7.2% |
| Interquartile Range (IQR) | 3.7% | 2.4% |
| Standard Deviation (Sample) | 3.5% | 3.3% |
| Standard Deviation (Population) | 3.4% | 3.3% |
Similar Demographics by Ambulatory Disability
Demographics Similar to Crow by Ambulatory Disability
In terms of ambulatory disability, the demographic groups most similar to Crow are Cape Verdean (6.9%, a difference of 0.070%), Alaskan Athabascan (6.9%, a difference of 0.23%), Immigrants from St. Vincent and the Grenadines (6.9%, a difference of 0.26%), French American Indian (6.9%, a difference of 0.40%), and Immigrants from Grenada (6.9%, a difference of 0.41%).
| Demographics | Rating | Rank | Ambulatory Disability |
| Immigrants | Nonimmigrants | 0.0 /100 | #288 | Tragic 6.9% |
| Immigrants | Dominica | 0.0 /100 | #289 | Tragic 6.9% |
| Scotch-Irish | 0.0 /100 | #290 | Tragic 6.9% |
| West Indians | 0.0 /100 | #291 | Tragic 6.9% |
| Cheyenne | 0.0 /100 | #292 | Tragic 6.9% |
| Immigrants | St. Vincent and the Grenadines | 0.0 /100 | #293 | Tragic 6.9% |
| Cape Verdeans | 0.0 /100 | #294 | Tragic 6.9% |
| Crow | 0.0 /100 | #295 | Tragic 6.9% |
| Alaskan Athabascans | 0.0 /100 | #296 | Tragic 6.9% |
| French American Indians | 0.0 /100 | #297 | Tragic 6.9% |
| Immigrants | Grenada | 0.0 /100 | #298 | Tragic 6.9% |
| Puget Sound Salish | 0.0 /100 | #299 | Tragic 6.9% |
| Marshallese | 0.0 /100 | #300 | Tragic 6.9% |
| British West Indians | 0.0 /100 | #301 | Tragic 7.0% |
| Immigrants | Armenia | 0.0 /100 | #302 | Tragic 7.0% |
Demographics Similar to Peruvians by Ambulatory Disability
In terms of ambulatory disability, the demographic groups most similar to Peruvians are Sierra Leonean (5.7%, a difference of 0.23%), Immigrants from Peru (5.7%, a difference of 0.32%), Brazilian (5.7%, a difference of 0.34%), Immigrants from Northern Africa (5.7%, a difference of 0.36%), and Immigrants from Cameroon (5.7%, a difference of 0.36%).
| Demographics | Rating | Rank | Ambulatory Disability |
| Immigrants | Spain | 99.7 /100 | #62 | Exceptional 5.6% |
| Immigrants | France | 99.7 /100 | #63 | Exceptional 5.6% |
| Laotians | 99.7 /100 | #64 | Exceptional 5.7% |
| Immigrants | Switzerland | 99.7 /100 | #65 | Exceptional 5.7% |
| Israelis | 99.6 /100 | #66 | Exceptional 5.7% |
| Immigrants | Uganda | 99.6 /100 | #67 | Exceptional 5.7% |
| Sri Lankans | 99.6 /100 | #68 | Exceptional 5.7% |
| Peruvians | 99.5 /100 | #69 | Exceptional 5.7% |
| Sierra Leoneans | 99.4 /100 | #70 | Exceptional 5.7% |
| Immigrants | Peru | 99.4 /100 | #71 | Exceptional 5.7% |
| Brazilians | 99.4 /100 | #72 | Exceptional 5.7% |
| Immigrants | Northern Africa | 99.4 /100 | #73 | Exceptional 5.7% |
| Immigrants | Cameroon | 99.4 /100 | #74 | Exceptional 5.7% |
| Immigrants | South Africa | 99.3 /100 | #75 | Exceptional 5.7% |
| Sudanese | 99.3 /100 | #76 | Exceptional 5.7% |