Irish vs Immigrants from Panama 9th Grade
COMPARE
Irish
Immigrants from Panama
9th Grade
9th Grade Comparison
Irish
Immigrants from Panama
96.5%
9TH GRADE
100.0/ 100
METRIC RATING
15th/ 347
METRIC RANK
94.3%
9TH GRADE
4.0/ 100
METRIC RATING
231st/ 347
METRIC RANK
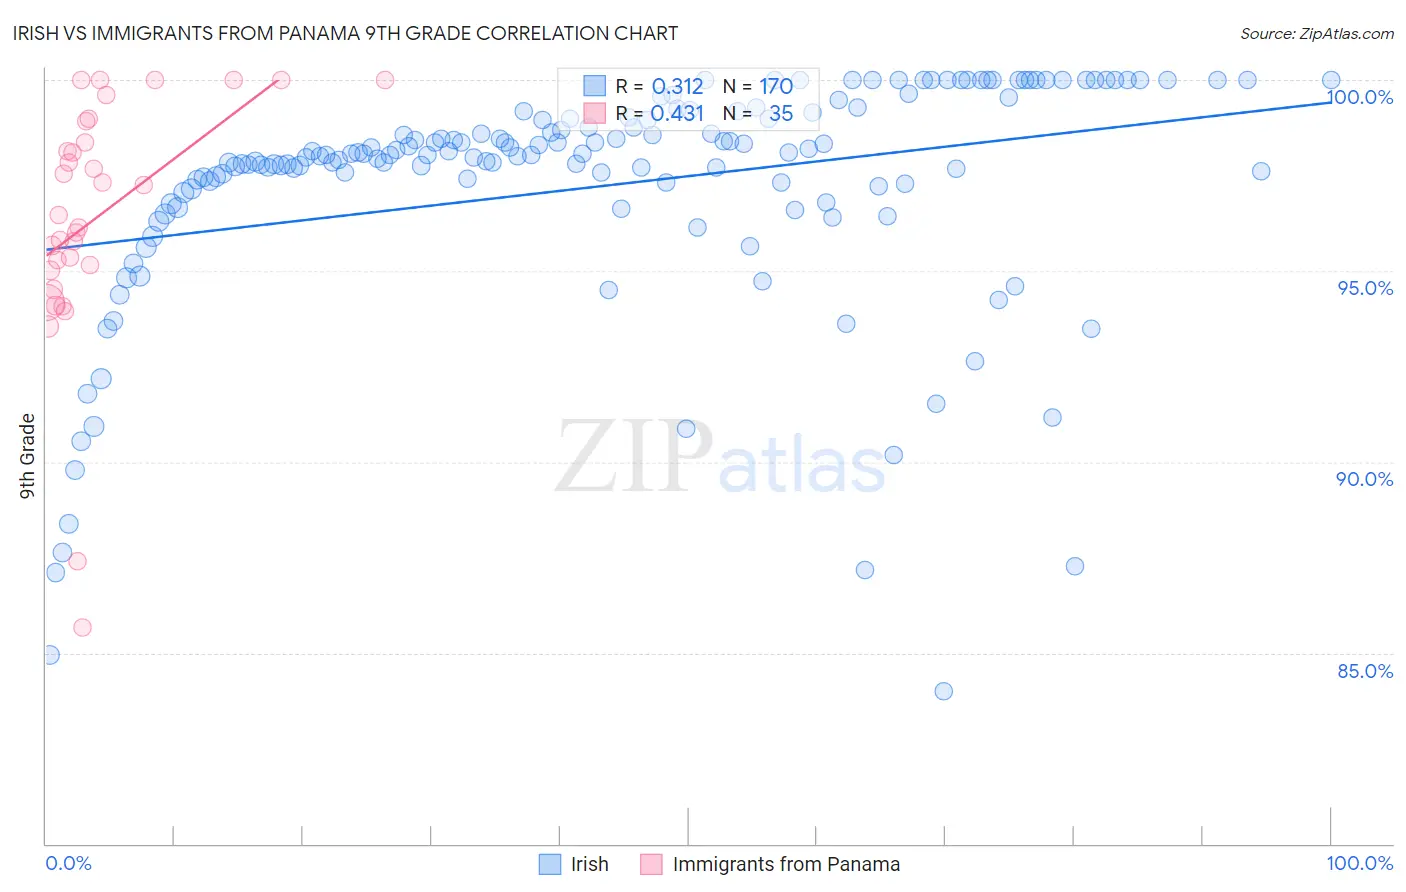
Irish vs Immigrants from Panama 9th Grade Correlation Chart
The statistical analysis conducted on geographies consisting of 580,710,287 people shows a mild positive correlation between the proportion of Irish and percentage of population with at least 9th grade education in the United States with a correlation coefficient (R) of 0.312 and weighted average of 96.5%. Similarly, the statistical analysis conducted on geographies consisting of 221,183,192 people shows a moderate positive correlation between the proportion of Immigrants from Panama and percentage of population with at least 9th grade education in the United States with a correlation coefficient (R) of 0.431 and weighted average of 94.3%, a difference of 2.3%.
9th Grade Correlation Summary
| Measurement | Irish | Immigrants from Panama |
| Minimum | 84.0% | 85.7% |
| Maximum | 100.0% | 100.0% |
| Range | 16.0% | 14.3% |
| Mean | 97.2% | 96.4% |
| Median | 98.0% | 96.5% |
| Interquartile 25% (IQ1) | 97.0% | 95.0% |
| Interquartile 75% (IQ3) | 99.0% | 98.9% |
| Interquartile Range (IQR) | 2.0% | 3.9% |
| Standard Deviation (Sample) | 3.1% | 3.2% |
| Standard Deviation (Population) | 3.1% | 3.2% |
Similar Demographics by 9th Grade
Demographics Similar to Irish by 9th Grade
In terms of 9th grade, the demographic groups most similar to Irish are Scottish (96.5%, a difference of 0.0%), Croatian (96.5%, a difference of 0.0%), Danish (96.5%, a difference of 0.010%), English (96.6%, a difference of 0.050%), and Dutch (96.5%, a difference of 0.060%).
| Demographics | Rating | Rank | 9th Grade |
| Germans | 100.0 /100 | #8 | Exceptional 96.7% |
| Tlingit-Haida | 100.0 /100 | #9 | Exceptional 96.6% |
| Lithuanians | 100.0 /100 | #10 | Exceptional 96.6% |
| Finns | 100.0 /100 | #11 | Exceptional 96.6% |
| English | 100.0 /100 | #12 | Exceptional 96.6% |
| Danes | 100.0 /100 | #13 | Exceptional 96.5% |
| Scottish | 100.0 /100 | #14 | Exceptional 96.5% |
| Irish | 100.0 /100 | #15 | Exceptional 96.5% |
| Croatians | 100.0 /100 | #16 | Exceptional 96.5% |
| Dutch | 100.0 /100 | #17 | Exceptional 96.5% |
| Scandinavians | 100.0 /100 | #18 | Exceptional 96.5% |
| Welsh | 100.0 /100 | #19 | Exceptional 96.4% |
| Italians | 100.0 /100 | #20 | Exceptional 96.4% |
| Alaskan Athabascans | 100.0 /100 | #21 | Exceptional 96.4% |
| Europeans | 100.0 /100 | #22 | Exceptional 96.4% |
Demographics Similar to Immigrants from Panama by 9th Grade
In terms of 9th grade, the demographic groups most similar to Immigrants from Panama are Apache (94.3%, a difference of 0.010%), Immigrants from Africa (94.3%, a difference of 0.010%), Immigrants from Southern Europe (94.3%, a difference of 0.020%), Nigerian (94.3%, a difference of 0.020%), and Costa Rican (94.3%, a difference of 0.020%).
| Demographics | Rating | Rank | 9th Grade |
| Tongans | 6.0 /100 | #224 | Tragic 94.4% |
| Ethiopians | 5.4 /100 | #225 | Tragic 94.4% |
| Sub-Saharan Africans | 5.4 /100 | #226 | Tragic 94.4% |
| Immigrants | Sierra Leone | 4.8 /100 | #227 | Tragic 94.4% |
| Lumbee | 4.7 /100 | #228 | Tragic 94.4% |
| Immigrants | Southern Europe | 4.5 /100 | #229 | Tragic 94.3% |
| Apache | 4.2 /100 | #230 | Tragic 94.3% |
| Immigrants | Panama | 4.0 /100 | #231 | Tragic 94.3% |
| Immigrants | Africa | 3.9 /100 | #232 | Tragic 94.3% |
| Nigerians | 3.7 /100 | #233 | Tragic 94.3% |
| Costa Ricans | 3.5 /100 | #234 | Tragic 94.3% |
| Bolivians | 3.3 /100 | #235 | Tragic 94.3% |
| Somalis | 2.9 /100 | #236 | Tragic 94.3% |
| Koreans | 2.9 /100 | #237 | Tragic 94.3% |
| South American Indians | 2.8 /100 | #238 | Tragic 94.3% |