Mexican American Indian vs Immigrants from North America Disability
COMPARE
Mexican American Indian
Immigrants from North America
Disability
Disability Comparison
Mexican American Indians
Immigrants from North America
12.0%
DISABILITY
11.4/ 100
METRIC RATING
204th/ 347
METRIC RANK
12.1%
DISABILITY
5.3/ 100
METRIC RATING
217th/ 347
METRIC RANK
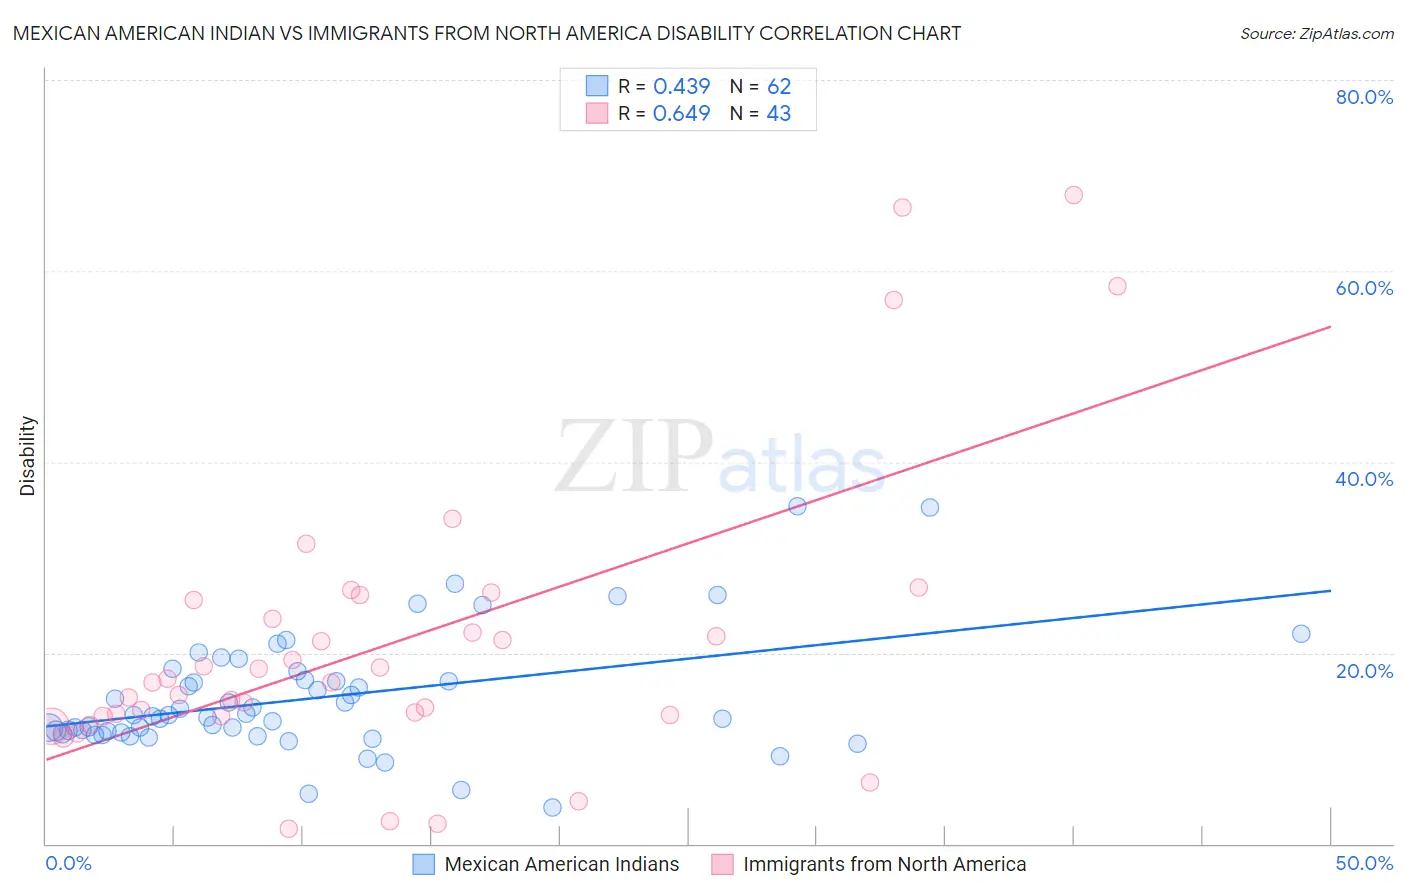
Mexican American Indian vs Immigrants from North America Disability Correlation Chart
The statistical analysis conducted on geographies consisting of 317,572,347 people shows a moderate positive correlation between the proportion of Mexican American Indians and percentage of population with a disability in the United States with a correlation coefficient (R) of 0.439 and weighted average of 12.0%. Similarly, the statistical analysis conducted on geographies consisting of 462,438,985 people shows a significant positive correlation between the proportion of Immigrants from North America and percentage of population with a disability in the United States with a correlation coefficient (R) of 0.649 and weighted average of 12.1%, a difference of 0.90%.
Disability Correlation Summary
| Measurement | Mexican American Indian | Immigrants from North America |
| Minimum | 3.8% | 1.6% |
| Maximum | 35.4% | 68.0% |
| Range | 31.6% | 66.4% |
| Mean | 15.3% | 21.0% |
| Median | 13.4% | 16.9% |
| Interquartile 25% (IQ1) | 11.6% | 13.3% |
| Interquartile 75% (IQ3) | 17.2% | 25.6% |
| Interquartile Range (IQR) | 5.6% | 12.2% |
| Standard Deviation (Sample) | 6.2% | 15.3% |
| Standard Deviation (Population) | 6.1% | 15.2% |
Demographics Similar to Mexican American Indians and Immigrants from North America by Disability
In terms of disability, the demographic groups most similar to Mexican American Indians are British West Indian (12.0%, a difference of 0.0%), Immigrants from England (12.0%, a difference of 0.050%), Assyrian/Chaldean/Syriac (11.9%, a difference of 0.12%), Belizean (11.9%, a difference of 0.14%), and Immigrants from Western Europe (12.0%, a difference of 0.16%). Similarly, the demographic groups most similar to Immigrants from North America are Panamanian (12.1%, a difference of 0.010%), Immigrants from Jamaica (12.1%, a difference of 0.060%), Croatian (12.1%, a difference of 0.11%), Immigrants from Bahamas (12.1%, a difference of 0.15%), and Immigrants from Canada (12.1%, a difference of 0.16%).
| Demographics | Rating | Rank | Disability |
| Belizeans | 12.8 /100 | #200 | Poor 11.9% |
| Assyrians/Chaldeans/Syriacs | 12.6 /100 | #201 | Poor 11.9% |
| Immigrants | England | 12.0 /100 | #202 | Poor 12.0% |
| British West Indians | 11.5 /100 | #203 | Poor 12.0% |
| Mexican American Indians | 11.4 /100 | #204 | Poor 12.0% |
| Immigrants | Western Europe | 10.1 /100 | #205 | Poor 12.0% |
| Immigrants | Senegal | 9.4 /100 | #206 | Tragic 12.0% |
| Immigrants | Thailand | 9.3 /100 | #207 | Tragic 12.0% |
| Immigrants | Caribbean | 9.1 /100 | #208 | Tragic 12.0% |
| Danes | 8.7 /100 | #209 | Tragic 12.0% |
| Czechs | 7.9 /100 | #210 | Tragic 12.0% |
| Immigrants | Cambodia | 7.3 /100 | #211 | Tragic 12.0% |
| Austrians | 7.2 /100 | #212 | Tragic 12.0% |
| Immigrants | Iraq | 7.1 /100 | #213 | Tragic 12.0% |
| Immigrants | Somalia | 6.8 /100 | #214 | Tragic 12.0% |
| Immigrants | Canada | 6.1 /100 | #215 | Tragic 12.1% |
| Panamanians | 5.4 /100 | #216 | Tragic 12.1% |
| Immigrants | North America | 5.3 /100 | #217 | Tragic 12.1% |
| Immigrants | Jamaica | 5.0 /100 | #218 | Tragic 12.1% |
| Croatians | 4.9 /100 | #219 | Tragic 12.1% |
| Immigrants | Bahamas | 4.7 /100 | #220 | Tragic 12.1% |