American vs West Indian Hearing Disability
COMPARE
American
West Indian
Hearing Disability
Hearing Disability Comparison
Americans
West Indians
3.9%
HEARING DISABILITY
0.0/ 100
METRIC RATING
311th/ 347
METRIC RANK
2.6%
HEARING DISABILITY
99.4/ 100
METRIC RATING
42nd/ 347
METRIC RANK
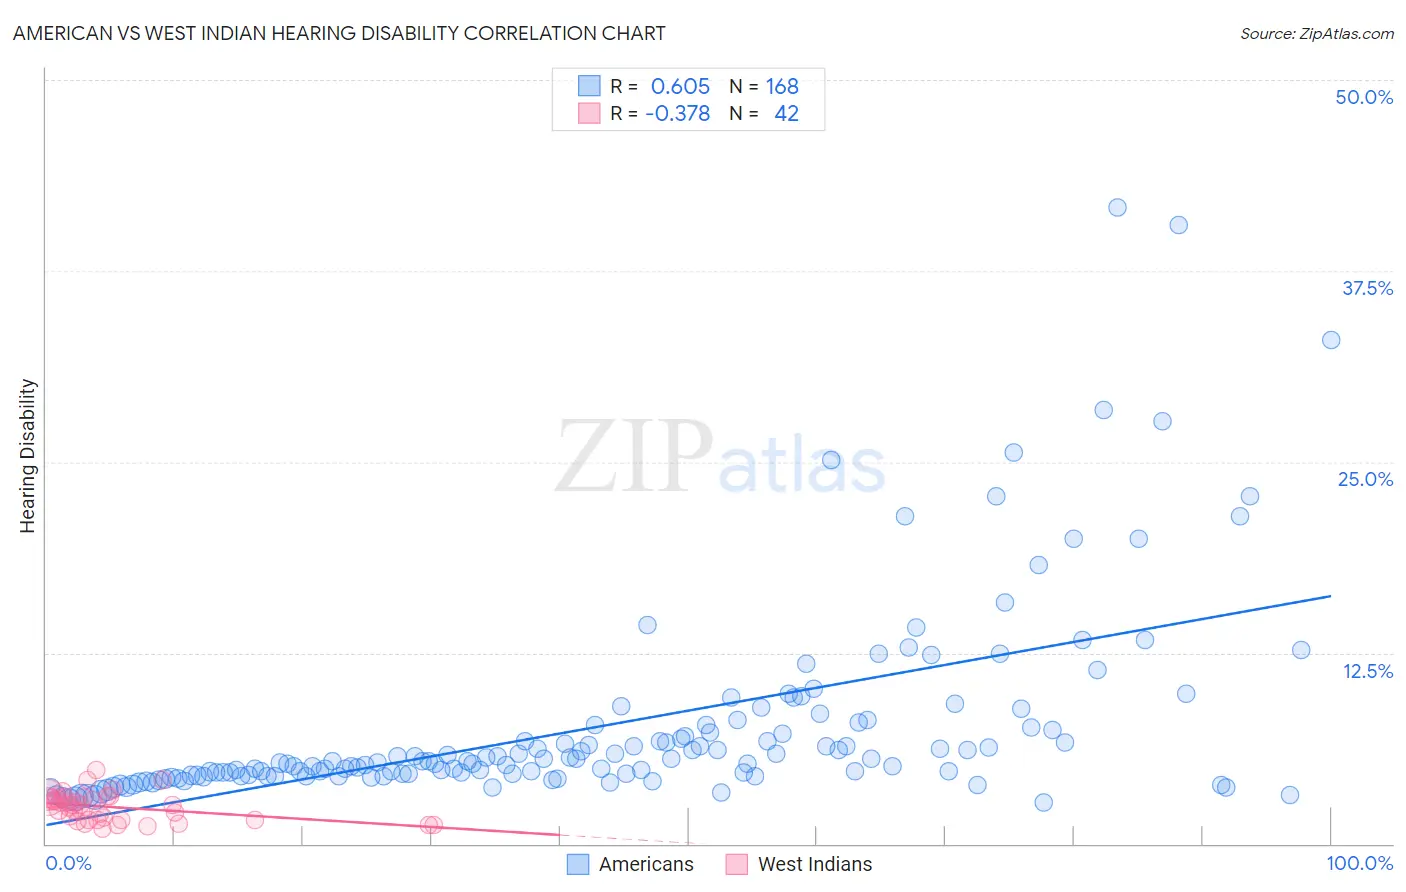
American vs West Indian Hearing Disability Correlation Chart
The statistical analysis conducted on geographies consisting of 581,034,081 people shows a significant positive correlation between the proportion of Americans and percentage of population with hearing disability in the United States with a correlation coefficient (R) of 0.605 and weighted average of 3.9%. Similarly, the statistical analysis conducted on geographies consisting of 253,938,353 people shows a mild negative correlation between the proportion of West Indians and percentage of population with hearing disability in the United States with a correlation coefficient (R) of -0.378 and weighted average of 2.6%, a difference of 47.8%.
Hearing Disability Correlation Summary
| Measurement | American | West Indian |
| Minimum | 2.7% | 1.0% |
| Maximum | 41.7% | 4.8% |
| Range | 38.9% | 3.8% |
| Mean | 7.7% | 2.4% |
| Median | 5.4% | 2.5% |
| Interquartile 25% (IQ1) | 4.5% | 1.6% |
| Interquartile 75% (IQ3) | 7.7% | 3.0% |
| Interquartile Range (IQR) | 3.2% | 1.4% |
| Standard Deviation (Sample) | 6.5% | 0.91% |
| Standard Deviation (Population) | 6.5% | 0.90% |
Similar Demographics by Hearing Disability
Demographics Similar to Americans by Hearing Disability
In terms of hearing disability, the demographic groups most similar to Americans are Cajun (3.9%, a difference of 1.1%), Hopi (3.9%, a difference of 1.2%), Cree (3.8%, a difference of 1.3%), Yakama (3.9%, a difference of 1.4%), and Puget Sound Salish (3.9%, a difference of 1.4%).
| Demographics | Rating | Rank | Hearing Disability |
| French | 0.0 /100 | #304 | Tragic 3.8% |
| English | 0.0 /100 | #305 | Tragic 3.8% |
| Marshallese | 0.0 /100 | #306 | Tragic 3.8% |
| French Canadians | 0.0 /100 | #307 | Tragic 3.8% |
| Ottawa | 0.0 /100 | #308 | Tragic 3.8% |
| Scotch-Irish | 0.0 /100 | #309 | Tragic 3.8% |
| Cree | 0.0 /100 | #310 | Tragic 3.8% |
| Americans | 0.0 /100 | #311 | Tragic 3.9% |
| Cajuns | 0.0 /100 | #312 | Tragic 3.9% |
| Hopi | 0.0 /100 | #313 | Tragic 3.9% |
| Yakama | 0.0 /100 | #314 | Tragic 3.9% |
| Puget Sound Salish | 0.0 /100 | #315 | Tragic 3.9% |
| Spanish Americans | 0.0 /100 | #316 | Tragic 4.0% |
| Comanche | 0.0 /100 | #317 | Tragic 4.0% |
| Cheyenne | 0.0 /100 | #318 | Tragic 4.0% |
Demographics Similar to West Indians by Hearing Disability
In terms of hearing disability, the demographic groups most similar to West Indians are Immigrants from Taiwan (2.6%, a difference of 0.010%), Senegalese (2.6%, a difference of 0.010%), Nigerian (2.6%, a difference of 0.23%), Venezuelan (2.6%, a difference of 0.25%), and Haitian (2.6%, a difference of 0.34%).
| Demographics | Rating | Rank | Hearing Disability |
| Salvadorans | 99.6 /100 | #35 | Exceptional 2.6% |
| Okinawans | 99.6 /100 | #36 | Exceptional 2.6% |
| Immigrants | Western Africa | 99.6 /100 | #37 | Exceptional 2.6% |
| Immigrants | Jamaica | 99.5 /100 | #38 | Exceptional 2.6% |
| Immigrants | China | 99.5 /100 | #39 | Exceptional 2.6% |
| Haitians | 99.5 /100 | #40 | Exceptional 2.6% |
| Immigrants | Taiwan | 99.4 /100 | #41 | Exceptional 2.6% |
| West Indians | 99.4 /100 | #42 | Exceptional 2.6% |
| Senegalese | 99.4 /100 | #43 | Exceptional 2.6% |
| Nigerians | 99.4 /100 | #44 | Exceptional 2.6% |
| Venezuelans | 99.4 /100 | #45 | Exceptional 2.6% |
| Immigrants | Dominica | 99.3 /100 | #46 | Exceptional 2.6% |
| Immigrants | Israel | 99.3 /100 | #47 | Exceptional 2.6% |
| Immigrants | Singapore | 99.3 /100 | #48 | Exceptional 2.6% |
| Immigrants | South America | 99.2 /100 | #49 | Exceptional 2.7% |