Puget Sound Salish vs Tlingit-Haida Hearing Disability
COMPARE
Puget Sound Salish
Tlingit-Haida
Hearing Disability
Hearing Disability Comparison
Puget Sound Salish
Tlingit-Haida
3.9%
HEARING DISABILITY
0.0/ 100
METRIC RATING
315th/ 347
METRIC RANK
4.8%
HEARING DISABILITY
0.0/ 100
METRIC RATING
344th/ 347
METRIC RANK
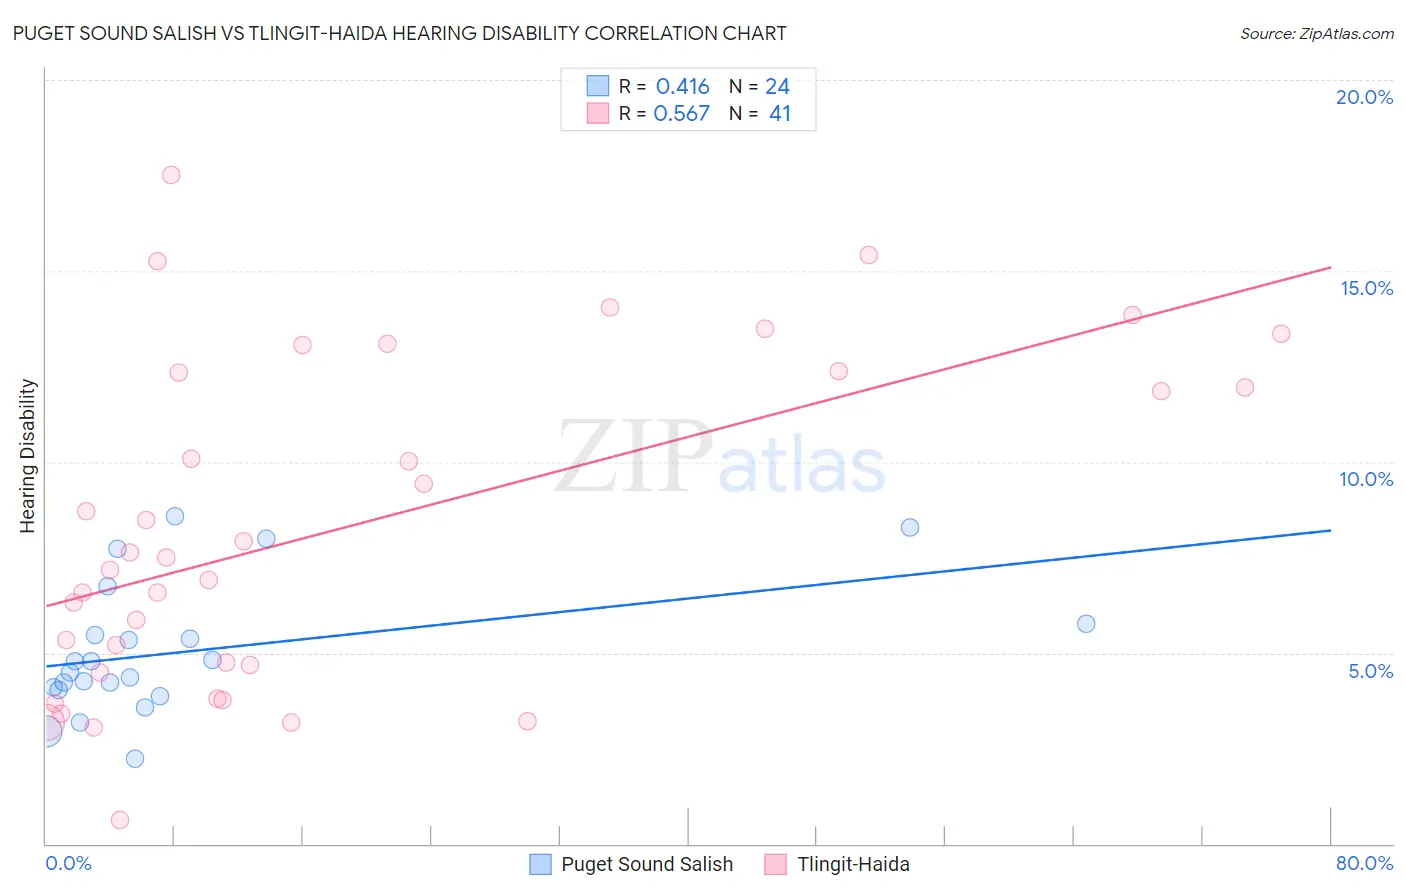
Puget Sound Salish vs Tlingit-Haida Hearing Disability Correlation Chart
The statistical analysis conducted on geographies consisting of 46,152,047 people shows a moderate positive correlation between the proportion of Puget Sound Salish and percentage of population with hearing disability in the United States with a correlation coefficient (R) of 0.416 and weighted average of 3.9%. Similarly, the statistical analysis conducted on geographies consisting of 60,852,790 people shows a substantial positive correlation between the proportion of Tlingit-Haida and percentage of population with hearing disability in the United States with a correlation coefficient (R) of 0.567 and weighted average of 4.8%, a difference of 22.7%.
Hearing Disability Correlation Summary
| Measurement | Puget Sound Salish | Tlingit-Haida |
| Minimum | 2.2% | 0.61% |
| Maximum | 8.6% | 17.5% |
| Range | 6.3% | 16.9% |
| Mean | 5.0% | 8.3% |
| Median | 4.6% | 7.5% |
| Interquartile 25% (IQ1) | 4.1% | 4.6% |
| Interquartile 75% (IQ3) | 5.6% | 12.4% |
| Interquartile Range (IQR) | 1.5% | 7.8% |
| Standard Deviation (Sample) | 1.7% | 4.3% |
| Standard Deviation (Population) | 1.7% | 4.3% |
Similar Demographics by Hearing Disability
Demographics Similar to Puget Sound Salish by Hearing Disability
In terms of hearing disability, the demographic groups most similar to Puget Sound Salish are Yakama (3.9%, a difference of 0.010%), Hopi (3.9%, a difference of 0.18%), Spanish American (4.0%, a difference of 0.20%), Cajun (3.9%, a difference of 0.29%), and Comanche (4.0%, a difference of 0.33%).
| Demographics | Rating | Rank | Hearing Disability |
| Ottawa | 0.0 /100 | #308 | Tragic 3.8% |
| Scotch-Irish | 0.0 /100 | #309 | Tragic 3.8% |
| Cree | 0.0 /100 | #310 | Tragic 3.8% |
| Americans | 0.0 /100 | #311 | Tragic 3.9% |
| Cajuns | 0.0 /100 | #312 | Tragic 3.9% |
| Hopi | 0.0 /100 | #313 | Tragic 3.9% |
| Yakama | 0.0 /100 | #314 | Tragic 3.9% |
| Puget Sound Salish | 0.0 /100 | #315 | Tragic 3.9% |
| Spanish Americans | 0.0 /100 | #316 | Tragic 4.0% |
| Comanche | 0.0 /100 | #317 | Tragic 4.0% |
| Cheyenne | 0.0 /100 | #318 | Tragic 4.0% |
| Chippewa | 0.0 /100 | #319 | Tragic 4.0% |
| Shoshone | 0.0 /100 | #320 | Tragic 4.0% |
| Paiute | 0.0 /100 | #321 | Tragic 4.1% |
| Seminole | 0.0 /100 | #322 | Tragic 4.1% |
Demographics Similar to Tlingit-Haida by Hearing Disability
In terms of hearing disability, the demographic groups most similar to Tlingit-Haida are Inupiat (4.7%, a difference of 2.7%), Tsimshian (4.7%, a difference of 2.9%), Navajo (4.6%, a difference of 4.5%), Pueblo (4.6%, a difference of 4.9%), and Choctaw (4.5%, a difference of 6.4%).
| Demographics | Rating | Rank | Hearing Disability |
| Dutch West Indians | 0.0 /100 | #333 | Tragic 4.3% |
| Aleuts | 0.0 /100 | #334 | Tragic 4.3% |
| Kiowa | 0.0 /100 | #335 | Tragic 4.3% |
| Creek | 0.0 /100 | #336 | Tragic 4.4% |
| Chickasaw | 0.0 /100 | #337 | Tragic 4.5% |
| Alaska Natives | 0.0 /100 | #338 | Tragic 4.5% |
| Choctaw | 0.0 /100 | #339 | Tragic 4.5% |
| Pueblo | 0.0 /100 | #340 | Tragic 4.6% |
| Navajo | 0.0 /100 | #341 | Tragic 4.6% |
| Tsimshian | 0.0 /100 | #342 | Tragic 4.7% |
| Inupiat | 0.0 /100 | #343 | Tragic 4.7% |
| Tlingit-Haida | 0.0 /100 | #344 | Tragic 4.8% |
| Alaskan Athabascans | 0.0 /100 | #345 | Tragic 5.3% |
| Colville | 0.0 /100 | #346 | Tragic 5.3% |
| Yup'ik | 0.0 /100 | #347 | Tragic 5.8% |