Immigrants from North Macedonia vs Tlingit-Haida Hearing Disability
COMPARE
Immigrants from North Macedonia
Tlingit-Haida
Hearing Disability
Hearing Disability Comparison
Immigrants from North Macedonia
Tlingit-Haida
3.1%
HEARING DISABILITY
19.1/ 100
METRIC RATING
200th/ 347
METRIC RANK
4.8%
HEARING DISABILITY
0.0/ 100
METRIC RATING
344th/ 347
METRIC RANK
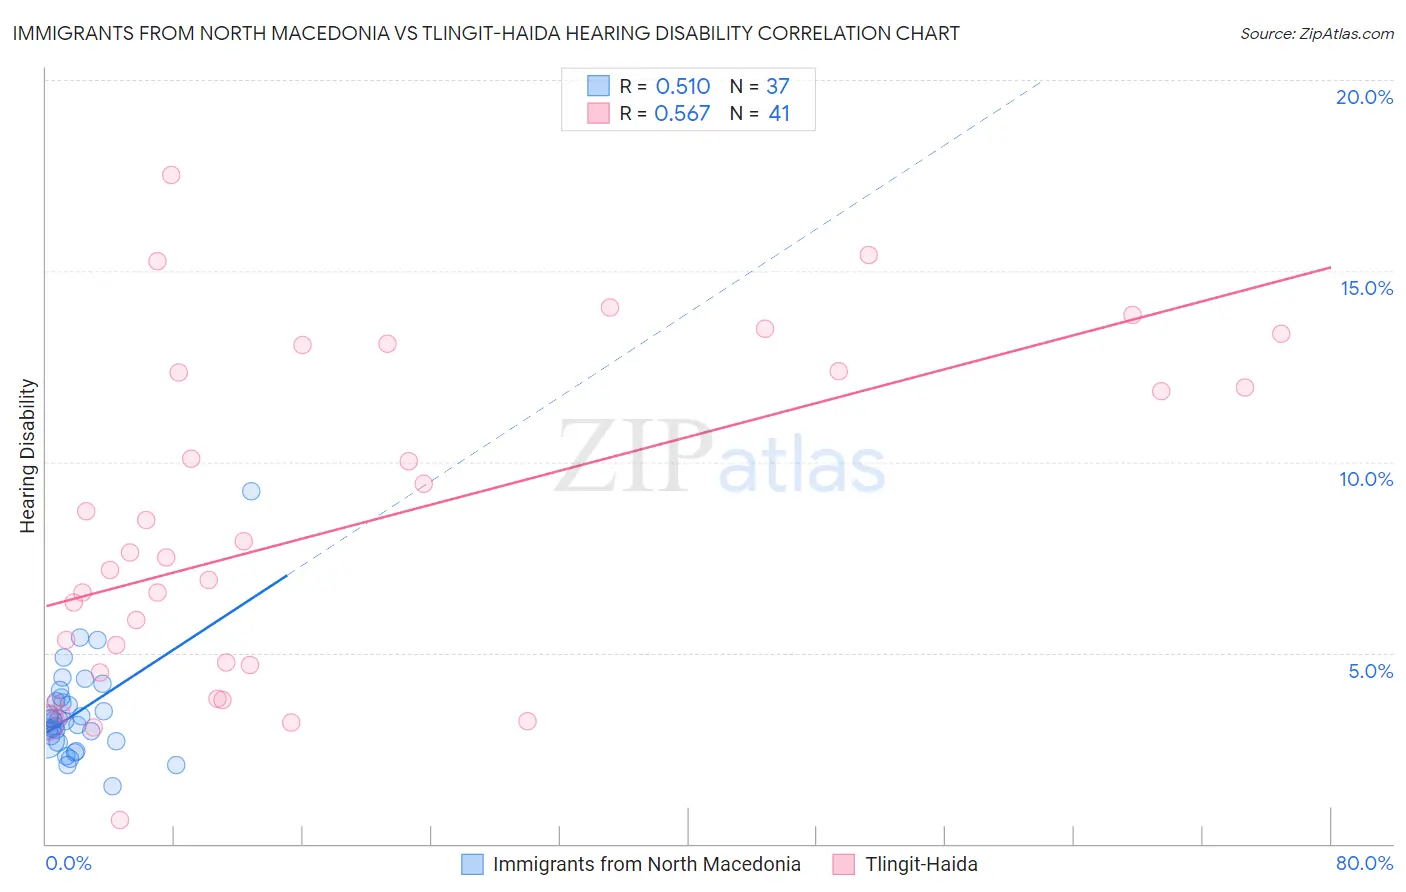
Immigrants from North Macedonia vs Tlingit-Haida Hearing Disability Correlation Chart
The statistical analysis conducted on geographies consisting of 74,314,151 people shows a substantial positive correlation between the proportion of Immigrants from North Macedonia and percentage of population with hearing disability in the United States with a correlation coefficient (R) of 0.510 and weighted average of 3.1%. Similarly, the statistical analysis conducted on geographies consisting of 60,852,790 people shows a substantial positive correlation between the proportion of Tlingit-Haida and percentage of population with hearing disability in the United States with a correlation coefficient (R) of 0.567 and weighted average of 4.8%, a difference of 56.4%.
Hearing Disability Correlation Summary
| Measurement | Immigrants from North Macedonia | Tlingit-Haida |
| Minimum | 1.5% | 0.61% |
| Maximum | 9.2% | 17.5% |
| Range | 7.7% | 16.9% |
| Mean | 3.4% | 8.3% |
| Median | 3.2% | 7.5% |
| Interquartile 25% (IQ1) | 2.7% | 4.6% |
| Interquartile 75% (IQ3) | 3.8% | 12.4% |
| Interquartile Range (IQR) | 1.1% | 7.8% |
| Standard Deviation (Sample) | 1.3% | 4.3% |
| Standard Deviation (Population) | 1.3% | 4.3% |
Similar Demographics by Hearing Disability
Demographics Similar to Immigrants from North Macedonia by Hearing Disability
In terms of hearing disability, the demographic groups most similar to Immigrants from North Macedonia are Syrian (3.1%, a difference of 0.010%), Iraqi (3.1%, a difference of 0.020%), Immigrants from Croatia (3.1%, a difference of 0.19%), Immigrants from Bosnia and Herzegovina (3.1%, a difference of 0.21%), and Immigrants from Thailand (3.1%, a difference of 0.42%).
| Demographics | Rating | Rank | Hearing Disability |
| Macedonians | 27.0 /100 | #193 | Fair 3.1% |
| South Africans | 24.5 /100 | #194 | Fair 3.1% |
| Spanish American Indians | 24.1 /100 | #195 | Fair 3.1% |
| Immigrants | Europe | 22.9 /100 | #196 | Fair 3.1% |
| Immigrants | Bosnia and Herzegovina | 20.6 /100 | #197 | Fair 3.1% |
| Immigrants | Croatia | 20.5 /100 | #198 | Fair 3.1% |
| Syrians | 19.2 /100 | #199 | Poor 3.1% |
| Immigrants | North Macedonia | 19.1 /100 | #200 | Poor 3.1% |
| Iraqis | 19.0 /100 | #201 | Poor 3.1% |
| Immigrants | Thailand | 16.4 /100 | #202 | Poor 3.1% |
| Immigrants | Denmark | 16.2 /100 | #203 | Poor 3.1% |
| Immigrants | Czechoslovakia | 15.9 /100 | #204 | Poor 3.1% |
| Alsatians | 15.9 /100 | #205 | Poor 3.1% |
| Eastern Europeans | 15.5 /100 | #206 | Poor 3.1% |
| Hispanics or Latinos | 15.1 /100 | #207 | Poor 3.1% |
Demographics Similar to Tlingit-Haida by Hearing Disability
In terms of hearing disability, the demographic groups most similar to Tlingit-Haida are Inupiat (4.7%, a difference of 2.7%), Tsimshian (4.7%, a difference of 2.9%), Navajo (4.6%, a difference of 4.5%), Pueblo (4.6%, a difference of 4.9%), and Choctaw (4.5%, a difference of 6.4%).
| Demographics | Rating | Rank | Hearing Disability |
| Dutch West Indians | 0.0 /100 | #333 | Tragic 4.3% |
| Aleuts | 0.0 /100 | #334 | Tragic 4.3% |
| Kiowa | 0.0 /100 | #335 | Tragic 4.3% |
| Creek | 0.0 /100 | #336 | Tragic 4.4% |
| Chickasaw | 0.0 /100 | #337 | Tragic 4.5% |
| Alaska Natives | 0.0 /100 | #338 | Tragic 4.5% |
| Choctaw | 0.0 /100 | #339 | Tragic 4.5% |
| Pueblo | 0.0 /100 | #340 | Tragic 4.6% |
| Navajo | 0.0 /100 | #341 | Tragic 4.6% |
| Tsimshian | 0.0 /100 | #342 | Tragic 4.7% |
| Inupiat | 0.0 /100 | #343 | Tragic 4.7% |
| Tlingit-Haida | 0.0 /100 | #344 | Tragic 4.8% |
| Alaskan Athabascans | 0.0 /100 | #345 | Tragic 5.3% |
| Colville | 0.0 /100 | #346 | Tragic 5.3% |
| Yup'ik | 0.0 /100 | #347 | Tragic 5.8% |