Iranian vs Scotch-Irish Disability Age 35 to 64
COMPARE
Iranian
Scotch-Irish
Disability Age 35 to 64
Disability Age 35 to 64 Comparison
Iranians
Scotch-Irish
8.7%
DISABILITY AGE 35 TO 64
100.0/ 100
METRIC RATING
8th/ 347
METRIC RANK
13.0%
DISABILITY AGE 35 TO 64
0.1/ 100
METRIC RATING
281st/ 347
METRIC RANK
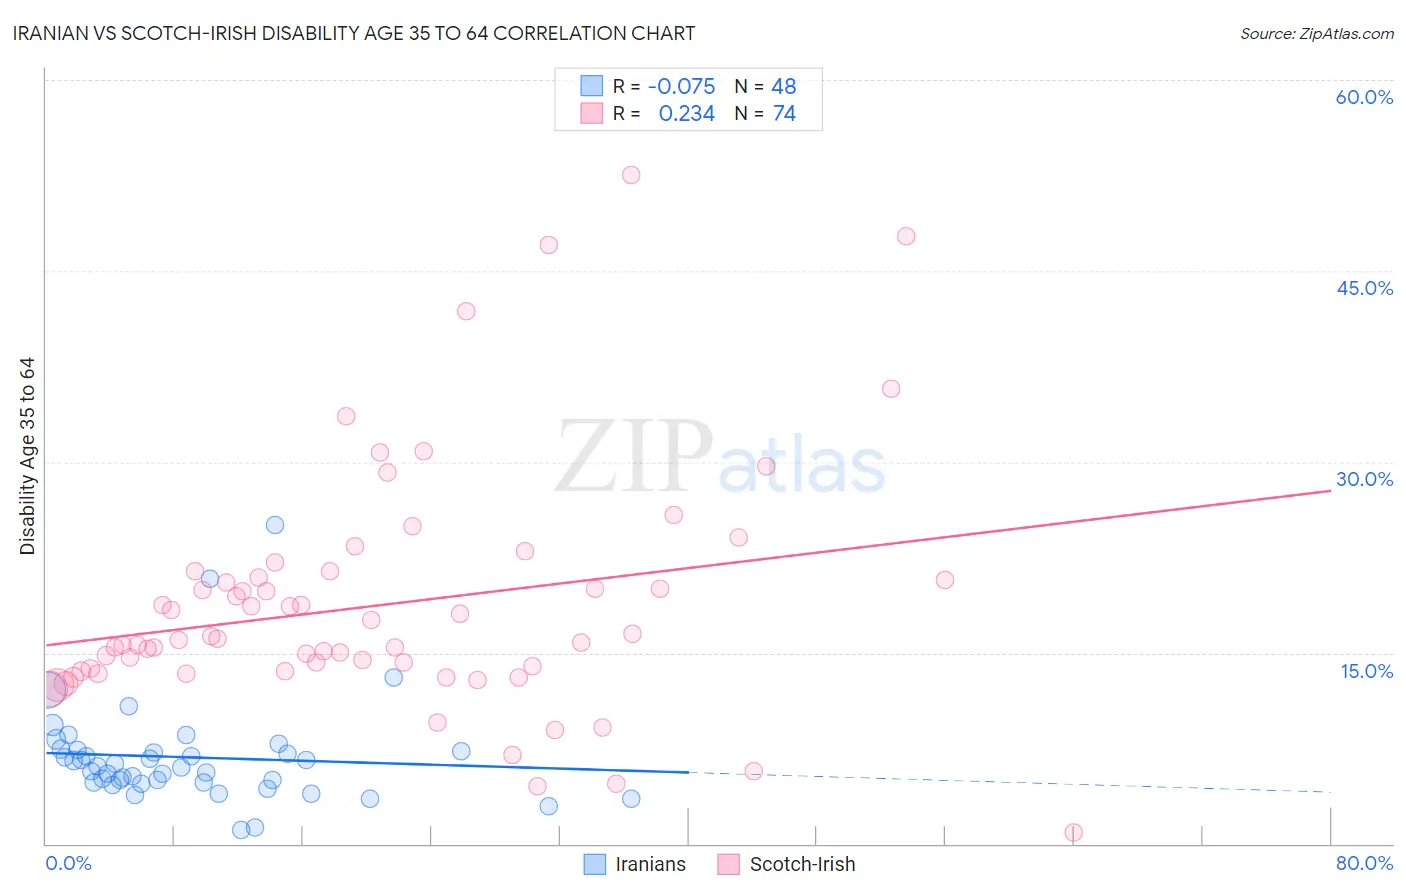
Iranian vs Scotch-Irish Disability Age 35 to 64 Correlation Chart
The statistical analysis conducted on geographies consisting of 316,627,091 people shows a slight negative correlation between the proportion of Iranians and percentage of population with a disability between the ages 34 and 64 in the United States with a correlation coefficient (R) of -0.075 and weighted average of 8.7%. Similarly, the statistical analysis conducted on geographies consisting of 548,060,326 people shows a weak positive correlation between the proportion of Scotch-Irish and percentage of population with a disability between the ages 34 and 64 in the United States with a correlation coefficient (R) of 0.234 and weighted average of 13.0%, a difference of 49.6%.
Disability Age 35 to 64 Correlation Summary
| Measurement | Iranian | Scotch-Irish |
| Minimum | 1.1% | 0.87% |
| Maximum | 25.0% | 52.5% |
| Range | 23.9% | 51.7% |
| Mean | 6.8% | 18.7% |
| Median | 6.0% | 16.1% |
| Interquartile 25% (IQ1) | 4.8% | 13.6% |
| Interquartile 75% (IQ3) | 7.3% | 20.9% |
| Interquartile Range (IQR) | 2.5% | 7.3% |
| Standard Deviation (Sample) | 4.1% | 9.4% |
| Standard Deviation (Population) | 4.1% | 9.4% |
Similar Demographics by Disability Age 35 to 64
Demographics Similar to Iranians by Disability Age 35 to 64
In terms of disability age 35 to 64, the demographic groups most similar to Iranians are Immigrants from China (8.7%, a difference of 0.43%), Immigrants from Israel (8.6%, a difference of 0.58%), Immigrants from Bolivia (8.7%, a difference of 0.70%), Thai (8.6%, a difference of 1.0%), and Immigrants from Eastern Asia (8.8%, a difference of 1.4%).
| Demographics | Rating | Rank | Disability Age 35 to 64 |
| Immigrants | Taiwan | 100.0 /100 | #1 | Exceptional 7.8% |
| Filipinos | 100.0 /100 | #2 | Exceptional 8.0% |
| Immigrants | Hong Kong | 100.0 /100 | #3 | Exceptional 8.2% |
| Immigrants | India | 100.0 /100 | #4 | Exceptional 8.3% |
| Immigrants | Iran | 100.0 /100 | #5 | Exceptional 8.5% |
| Thais | 100.0 /100 | #6 | Exceptional 8.6% |
| Immigrants | Israel | 100.0 /100 | #7 | Exceptional 8.6% |
| Iranians | 100.0 /100 | #8 | Exceptional 8.7% |
| Immigrants | China | 100.0 /100 | #9 | Exceptional 8.7% |
| Immigrants | Bolivia | 100.0 /100 | #10 | Exceptional 8.7% |
| Immigrants | Eastern Asia | 100.0 /100 | #11 | Exceptional 8.8% |
| Indians (Asian) | 100.0 /100 | #12 | Exceptional 8.9% |
| Immigrants | South Central Asia | 100.0 /100 | #13 | Exceptional 8.9% |
| Immigrants | Singapore | 100.0 /100 | #14 | Exceptional 8.9% |
| Bolivians | 100.0 /100 | #15 | Exceptional 8.9% |
Demographics Similar to Scotch-Irish by Disability Age 35 to 64
In terms of disability age 35 to 64, the demographic groups most similar to Scotch-Irish are Immigrants from Laos (13.0%, a difference of 0.090%), Liberian (12.9%, a difference of 0.20%), Immigrants from Micronesia (12.9%, a difference of 0.36%), French Canadian (12.9%, a difference of 0.39%), and Immigrants from Dominican Republic (12.9%, a difference of 0.42%).
| Demographics | Rating | Rank | Disability Age 35 to 64 |
| Celtics | 0.1 /100 | #274 | Tragic 12.9% |
| Dominicans | 0.1 /100 | #275 | Tragic 12.9% |
| Somalis | 0.1 /100 | #276 | Tragic 12.9% |
| Immigrants | Dominican Republic | 0.1 /100 | #277 | Tragic 12.9% |
| French Canadians | 0.1 /100 | #278 | Tragic 12.9% |
| Immigrants | Micronesia | 0.1 /100 | #279 | Tragic 12.9% |
| Liberians | 0.1 /100 | #280 | Tragic 12.9% |
| Scotch-Irish | 0.1 /100 | #281 | Tragic 13.0% |
| Immigrants | Laos | 0.1 /100 | #282 | Tragic 13.0% |
| Central American Indians | 0.0 /100 | #283 | Tragic 13.0% |
| Immigrants | Nonimmigrants | 0.0 /100 | #284 | Tragic 13.0% |
| Immigrants | Somalia | 0.0 /100 | #285 | Tragic 13.1% |
| Hmong | 0.0 /100 | #286 | Tragic 13.1% |
| Tlingit-Haida | 0.0 /100 | #287 | Tragic 13.2% |
| Fijians | 0.0 /100 | #288 | Tragic 13.2% |