Kenyan vs Scotch-Irish Disability Age 35 to 64
COMPARE
Kenyan
Scotch-Irish
Disability Age 35 to 64
Disability Age 35 to 64 Comparison
Kenyans
Scotch-Irish
11.4%
DISABILITY AGE 35 TO 64
39.2/ 100
METRIC RATING
184th/ 347
METRIC RANK
13.0%
DISABILITY AGE 35 TO 64
0.1/ 100
METRIC RATING
281st/ 347
METRIC RANK
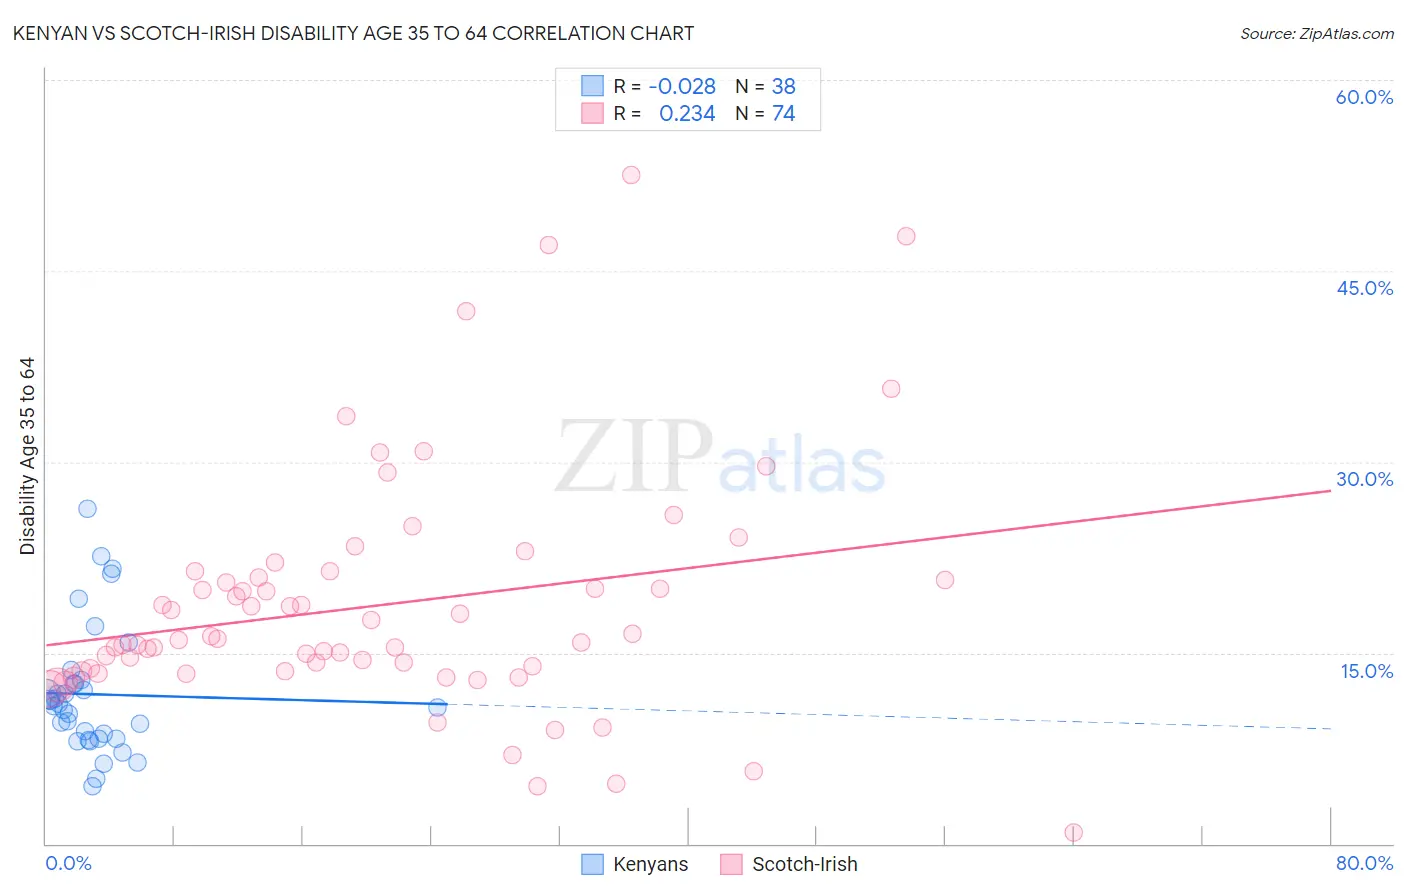
Kenyan vs Scotch-Irish Disability Age 35 to 64 Correlation Chart
The statistical analysis conducted on geographies consisting of 168,160,761 people shows no correlation between the proportion of Kenyans and percentage of population with a disability between the ages 34 and 64 in the United States with a correlation coefficient (R) of -0.028 and weighted average of 11.4%. Similarly, the statistical analysis conducted on geographies consisting of 548,060,326 people shows a weak positive correlation between the proportion of Scotch-Irish and percentage of population with a disability between the ages 34 and 64 in the United States with a correlation coefficient (R) of 0.234 and weighted average of 13.0%, a difference of 14.0%.
Disability Age 35 to 64 Correlation Summary
| Measurement | Kenyan | Scotch-Irish |
| Minimum | 4.5% | 0.87% |
| Maximum | 26.3% | 52.5% |
| Range | 21.8% | 51.7% |
| Mean | 11.7% | 18.7% |
| Median | 10.9% | 16.1% |
| Interquartile 25% (IQ1) | 8.2% | 13.6% |
| Interquartile 75% (IQ3) | 12.5% | 20.9% |
| Interquartile Range (IQR) | 4.3% | 7.3% |
| Standard Deviation (Sample) | 4.9% | 9.4% |
| Standard Deviation (Population) | 4.9% | 9.4% |
Similar Demographics by Disability Age 35 to 64
Demographics Similar to Kenyans by Disability Age 35 to 64
In terms of disability age 35 to 64, the demographic groups most similar to Kenyans are Immigrants from Oceania (11.4%, a difference of 0.030%), Icelander (11.4%, a difference of 0.040%), Trinidadian and Tobagonian (11.4%, a difference of 0.13%), Immigrants from Caribbean (11.3%, a difference of 0.19%), and Immigrants from Barbados (11.3%, a difference of 0.20%).
| Demographics | Rating | Rank | Disability Age 35 to 64 |
| Immigrants | Eastern Africa | 42.2 /100 | #177 | Average 11.3% |
| Poles | 42.0 /100 | #178 | Average 11.3% |
| Immigrants | Barbados | 41.6 /100 | #179 | Average 11.3% |
| Immigrants | Caribbean | 41.5 /100 | #180 | Average 11.3% |
| Trinidadians and Tobagonians | 40.8 /100 | #181 | Average 11.4% |
| Icelanders | 39.7 /100 | #182 | Fair 11.4% |
| Immigrants | Oceania | 39.5 /100 | #183 | Fair 11.4% |
| Kenyans | 39.2 /100 | #184 | Fair 11.4% |
| Danes | 36.8 /100 | #185 | Fair 11.4% |
| Slovenes | 36.6 /100 | #186 | Fair 11.4% |
| Immigrants | Bosnia and Herzegovina | 35.2 /100 | #187 | Fair 11.4% |
| Northern Europeans | 34.9 /100 | #188 | Fair 11.4% |
| Hungarians | 34.6 /100 | #189 | Fair 11.4% |
| Immigrants | Nigeria | 32.5 /100 | #190 | Fair 11.4% |
| Swedes | 31.3 /100 | #191 | Fair 11.4% |
Demographics Similar to Scotch-Irish by Disability Age 35 to 64
In terms of disability age 35 to 64, the demographic groups most similar to Scotch-Irish are Immigrants from Laos (13.0%, a difference of 0.090%), Liberian (12.9%, a difference of 0.20%), Immigrants from Micronesia (12.9%, a difference of 0.36%), French Canadian (12.9%, a difference of 0.39%), and Immigrants from Dominican Republic (12.9%, a difference of 0.42%).
| Demographics | Rating | Rank | Disability Age 35 to 64 |
| Celtics | 0.1 /100 | #274 | Tragic 12.9% |
| Dominicans | 0.1 /100 | #275 | Tragic 12.9% |
| Somalis | 0.1 /100 | #276 | Tragic 12.9% |
| Immigrants | Dominican Republic | 0.1 /100 | #277 | Tragic 12.9% |
| French Canadians | 0.1 /100 | #278 | Tragic 12.9% |
| Immigrants | Micronesia | 0.1 /100 | #279 | Tragic 12.9% |
| Liberians | 0.1 /100 | #280 | Tragic 12.9% |
| Scotch-Irish | 0.1 /100 | #281 | Tragic 13.0% |
| Immigrants | Laos | 0.1 /100 | #282 | Tragic 13.0% |
| Central American Indians | 0.0 /100 | #283 | Tragic 13.0% |
| Immigrants | Nonimmigrants | 0.0 /100 | #284 | Tragic 13.0% |
| Immigrants | Somalia | 0.0 /100 | #285 | Tragic 13.1% |
| Hmong | 0.0 /100 | #286 | Tragic 13.1% |
| Tlingit-Haida | 0.0 /100 | #287 | Tragic 13.2% |
| Fijians | 0.0 /100 | #288 | Tragic 13.2% |