Iranian vs Polish Disability Age 35 to 64
COMPARE
Iranian
Polish
Disability Age 35 to 64
Disability Age 35 to 64 Comparison
Iranians
Poles
8.7%
DISABILITY AGE 35 TO 64
100.0/ 100
METRIC RATING
8th/ 347
METRIC RANK
11.3%
DISABILITY AGE 35 TO 64
42.0/ 100
METRIC RATING
178th/ 347
METRIC RANK
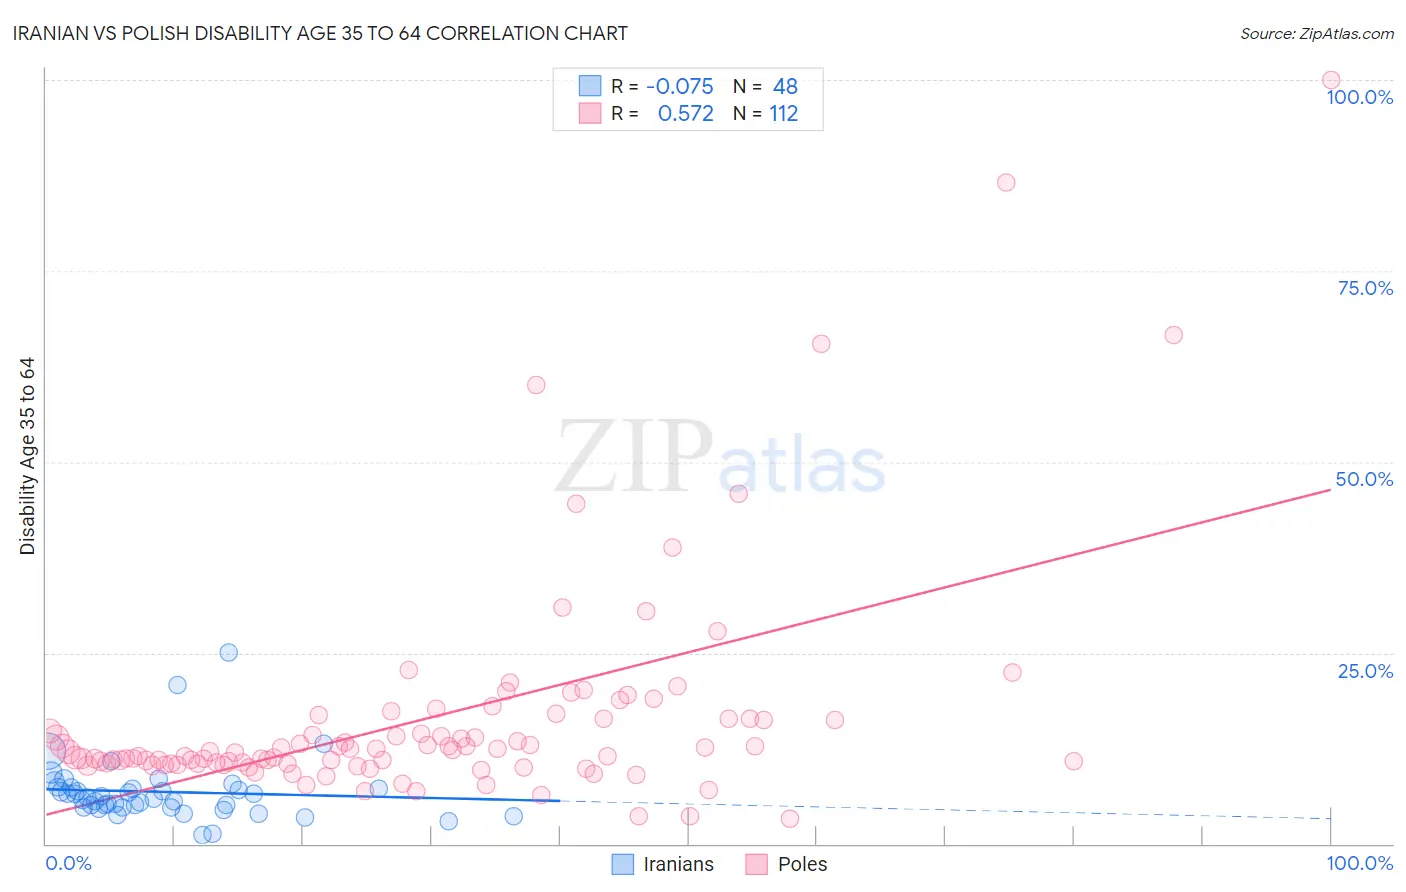
Iranian vs Polish Disability Age 35 to 64 Correlation Chart
The statistical analysis conducted on geographies consisting of 316,627,091 people shows a slight negative correlation between the proportion of Iranians and percentage of population with a disability between the ages 34 and 64 in the United States with a correlation coefficient (R) of -0.075 and weighted average of 8.7%. Similarly, the statistical analysis conducted on geographies consisting of 559,533,699 people shows a substantial positive correlation between the proportion of Poles and percentage of population with a disability between the ages 34 and 64 in the United States with a correlation coefficient (R) of 0.572 and weighted average of 11.3%, a difference of 31.0%.
Disability Age 35 to 64 Correlation Summary
| Measurement | Iranian | Polish |
| Minimum | 1.1% | 3.3% |
| Maximum | 25.0% | 100.0% |
| Range | 23.9% | 96.7% |
| Mean | 6.8% | 16.5% |
| Median | 6.0% | 12.0% |
| Interquartile 25% (IQ1) | 4.8% | 10.5% |
| Interquartile 75% (IQ3) | 7.3% | 16.4% |
| Interquartile Range (IQR) | 2.5% | 5.9% |
| Standard Deviation (Sample) | 4.1% | 14.9% |
| Standard Deviation (Population) | 4.1% | 14.8% |
Similar Demographics by Disability Age 35 to 64
Demographics Similar to Iranians by Disability Age 35 to 64
In terms of disability age 35 to 64, the demographic groups most similar to Iranians are Immigrants from China (8.7%, a difference of 0.43%), Immigrants from Israel (8.6%, a difference of 0.58%), Immigrants from Bolivia (8.7%, a difference of 0.70%), Thai (8.6%, a difference of 1.0%), and Immigrants from Eastern Asia (8.8%, a difference of 1.4%).
| Demographics | Rating | Rank | Disability Age 35 to 64 |
| Immigrants | Taiwan | 100.0 /100 | #1 | Exceptional 7.8% |
| Filipinos | 100.0 /100 | #2 | Exceptional 8.0% |
| Immigrants | Hong Kong | 100.0 /100 | #3 | Exceptional 8.2% |
| Immigrants | India | 100.0 /100 | #4 | Exceptional 8.3% |
| Immigrants | Iran | 100.0 /100 | #5 | Exceptional 8.5% |
| Thais | 100.0 /100 | #6 | Exceptional 8.6% |
| Immigrants | Israel | 100.0 /100 | #7 | Exceptional 8.6% |
| Iranians | 100.0 /100 | #8 | Exceptional 8.7% |
| Immigrants | China | 100.0 /100 | #9 | Exceptional 8.7% |
| Immigrants | Bolivia | 100.0 /100 | #10 | Exceptional 8.7% |
| Immigrants | Eastern Asia | 100.0 /100 | #11 | Exceptional 8.8% |
| Indians (Asian) | 100.0 /100 | #12 | Exceptional 8.9% |
| Immigrants | South Central Asia | 100.0 /100 | #13 | Exceptional 8.9% |
| Immigrants | Singapore | 100.0 /100 | #14 | Exceptional 8.9% |
| Bolivians | 100.0 /100 | #15 | Exceptional 8.9% |
Demographics Similar to Poles by Disability Age 35 to 64
In terms of disability age 35 to 64, the demographic groups most similar to Poles are Immigrants from Eastern Africa (11.3%, a difference of 0.020%), Immigrants from Barbados (11.3%, a difference of 0.040%), Immigrants from Caribbean (11.3%, a difference of 0.040%), Trinidadian and Tobagonian (11.4%, a difference of 0.10%), and Ugandan (11.3%, a difference of 0.14%).
| Demographics | Rating | Rank | Disability Age 35 to 64 |
| Immigrants | Trinidad and Tobago | 55.9 /100 | #171 | Average 11.2% |
| Italians | 55.6 /100 | #172 | Average 11.2% |
| Lebanese | 51.8 /100 | #173 | Average 11.3% |
| Immigrants | Fiji | 50.0 /100 | #174 | Average 11.3% |
| Czechs | 47.9 /100 | #175 | Average 11.3% |
| Ugandans | 43.7 /100 | #176 | Average 11.3% |
| Immigrants | Eastern Africa | 42.2 /100 | #177 | Average 11.3% |
| Poles | 42.0 /100 | #178 | Average 11.3% |
| Immigrants | Barbados | 41.6 /100 | #179 | Average 11.3% |
| Immigrants | Caribbean | 41.5 /100 | #180 | Average 11.3% |
| Trinidadians and Tobagonians | 40.8 /100 | #181 | Average 11.4% |
| Icelanders | 39.7 /100 | #182 | Fair 11.4% |
| Immigrants | Oceania | 39.5 /100 | #183 | Fair 11.4% |
| Kenyans | 39.2 /100 | #184 | Fair 11.4% |
| Danes | 36.8 /100 | #185 | Fair 11.4% |