Iranian vs Northern European Disability Age 35 to 64
COMPARE
Iranian
Northern European
Disability Age 35 to 64
Disability Age 35 to 64 Comparison
Iranians
Northern Europeans
8.7%
DISABILITY AGE 35 TO 64
100.0/ 100
METRIC RATING
8th/ 347
METRIC RANK
11.4%
DISABILITY AGE 35 TO 64
34.9/ 100
METRIC RATING
188th/ 347
METRIC RANK
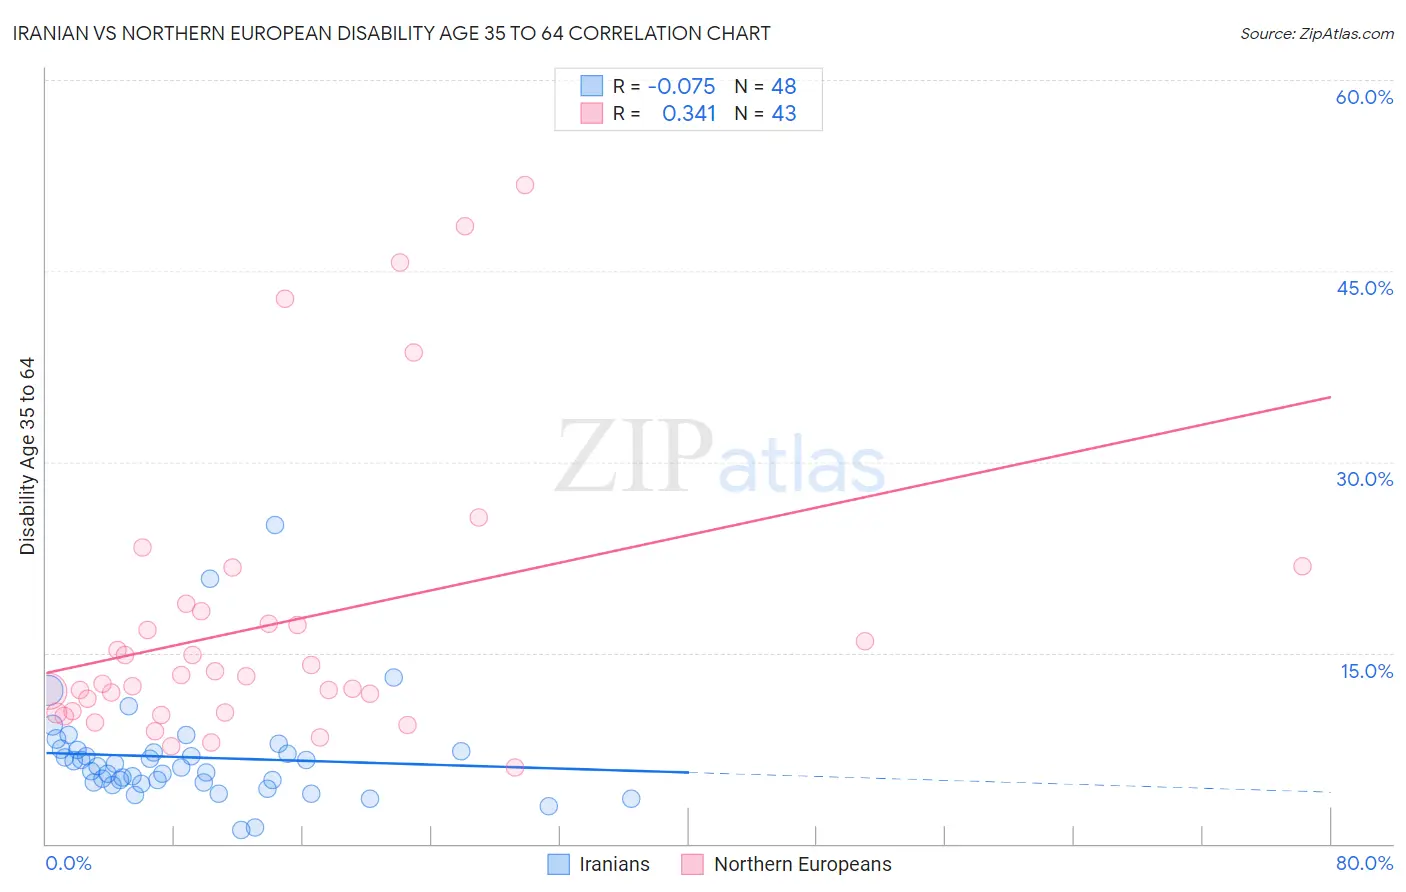
Iranian vs Northern European Disability Age 35 to 64 Correlation Chart
The statistical analysis conducted on geographies consisting of 316,627,091 people shows a slight negative correlation between the proportion of Iranians and percentage of population with a disability between the ages 34 and 64 in the United States with a correlation coefficient (R) of -0.075 and weighted average of 8.7%. Similarly, the statistical analysis conducted on geographies consisting of 405,868,631 people shows a mild positive correlation between the proportion of Northern Europeans and percentage of population with a disability between the ages 34 and 64 in the United States with a correlation coefficient (R) of 0.341 and weighted average of 11.4%, a difference of 31.8%.
Disability Age 35 to 64 Correlation Summary
| Measurement | Iranian | Northern European |
| Minimum | 1.1% | 6.0% |
| Maximum | 25.0% | 51.8% |
| Range | 23.9% | 45.7% |
| Mean | 6.8% | 17.2% |
| Median | 6.0% | 13.1% |
| Interquartile 25% (IQ1) | 4.8% | 10.3% |
| Interquartile 75% (IQ3) | 7.3% | 18.3% |
| Interquartile Range (IQR) | 2.5% | 8.0% |
| Standard Deviation (Sample) | 4.1% | 11.3% |
| Standard Deviation (Population) | 4.1% | 11.2% |
Similar Demographics by Disability Age 35 to 64
Demographics Similar to Iranians by Disability Age 35 to 64
In terms of disability age 35 to 64, the demographic groups most similar to Iranians are Immigrants from China (8.7%, a difference of 0.43%), Immigrants from Israel (8.6%, a difference of 0.58%), Immigrants from Bolivia (8.7%, a difference of 0.70%), Thai (8.6%, a difference of 1.0%), and Immigrants from Eastern Asia (8.8%, a difference of 1.4%).
| Demographics | Rating | Rank | Disability Age 35 to 64 |
| Immigrants | Taiwan | 100.0 /100 | #1 | Exceptional 7.8% |
| Filipinos | 100.0 /100 | #2 | Exceptional 8.0% |
| Immigrants | Hong Kong | 100.0 /100 | #3 | Exceptional 8.2% |
| Immigrants | India | 100.0 /100 | #4 | Exceptional 8.3% |
| Immigrants | Iran | 100.0 /100 | #5 | Exceptional 8.5% |
| Thais | 100.0 /100 | #6 | Exceptional 8.6% |
| Immigrants | Israel | 100.0 /100 | #7 | Exceptional 8.6% |
| Iranians | 100.0 /100 | #8 | Exceptional 8.7% |
| Immigrants | China | 100.0 /100 | #9 | Exceptional 8.7% |
| Immigrants | Bolivia | 100.0 /100 | #10 | Exceptional 8.7% |
| Immigrants | Eastern Asia | 100.0 /100 | #11 | Exceptional 8.8% |
| Indians (Asian) | 100.0 /100 | #12 | Exceptional 8.9% |
| Immigrants | South Central Asia | 100.0 /100 | #13 | Exceptional 8.9% |
| Immigrants | Singapore | 100.0 /100 | #14 | Exceptional 8.9% |
| Bolivians | 100.0 /100 | #15 | Exceptional 8.9% |
Demographics Similar to Northern Europeans by Disability Age 35 to 64
In terms of disability age 35 to 64, the demographic groups most similar to Northern Europeans are Immigrants from Bosnia and Herzegovina (11.4%, a difference of 0.020%), Hungarian (11.4%, a difference of 0.020%), Slovene (11.4%, a difference of 0.15%), Danish (11.4%, a difference of 0.16%), and Immigrants from Nigeria (11.4%, a difference of 0.21%).
| Demographics | Rating | Rank | Disability Age 35 to 64 |
| Trinidadians and Tobagonians | 40.8 /100 | #181 | Average 11.4% |
| Icelanders | 39.7 /100 | #182 | Fair 11.4% |
| Immigrants | Oceania | 39.5 /100 | #183 | Fair 11.4% |
| Kenyans | 39.2 /100 | #184 | Fair 11.4% |
| Danes | 36.8 /100 | #185 | Fair 11.4% |
| Slovenes | 36.6 /100 | #186 | Fair 11.4% |
| Immigrants | Bosnia and Herzegovina | 35.2 /100 | #187 | Fair 11.4% |
| Northern Europeans | 34.9 /100 | #188 | Fair 11.4% |
| Hungarians | 34.6 /100 | #189 | Fair 11.4% |
| Immigrants | Nigeria | 32.5 /100 | #190 | Fair 11.4% |
| Swedes | 31.3 /100 | #191 | Fair 11.4% |
| Norwegians | 29.7 /100 | #192 | Fair 11.5% |
| Immigrants | Africa | 29.0 /100 | #193 | Fair 11.5% |
| Immigrants | Latin America | 27.5 /100 | #194 | Fair 11.5% |
| Carpatho Rusyns | 25.3 /100 | #195 | Fair 11.5% |