Iranian vs Immigrants from Greece Disability Age 35 to 64
COMPARE
Iranian
Immigrants from Greece
Disability Age 35 to 64
Disability Age 35 to 64 Comparison
Iranians
Immigrants from Greece
8.7%
DISABILITY AGE 35 TO 64
100.0/ 100
METRIC RATING
8th/ 347
METRIC RANK
9.8%
DISABILITY AGE 35 TO 64
99.8/ 100
METRIC RATING
49th/ 347
METRIC RANK
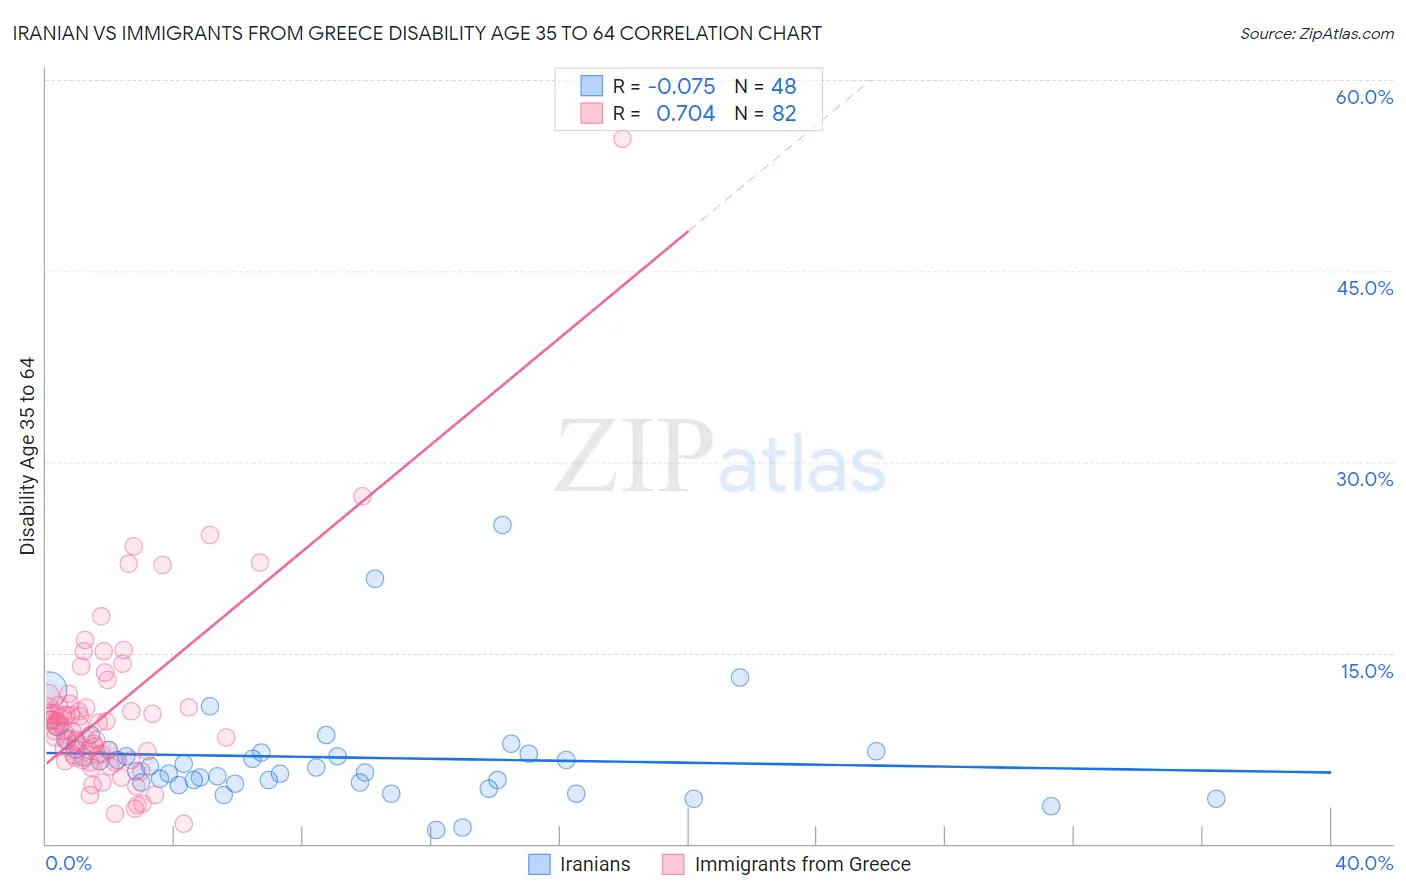
Iranian vs Immigrants from Greece Disability Age 35 to 64 Correlation Chart
The statistical analysis conducted on geographies consisting of 316,627,091 people shows a slight negative correlation between the proportion of Iranians and percentage of population with a disability between the ages 34 and 64 in the United States with a correlation coefficient (R) of -0.075 and weighted average of 8.7%. Similarly, the statistical analysis conducted on geographies consisting of 216,854,887 people shows a strong positive correlation between the proportion of Immigrants from Greece and percentage of population with a disability between the ages 34 and 64 in the United States with a correlation coefficient (R) of 0.704 and weighted average of 9.8%, a difference of 13.4%.
Disability Age 35 to 64 Correlation Summary
| Measurement | Iranian | Immigrants from Greece |
| Minimum | 1.1% | 1.5% |
| Maximum | 25.0% | 55.4% |
| Range | 23.9% | 53.9% |
| Mean | 6.8% | 10.4% |
| Median | 6.0% | 9.2% |
| Interquartile 25% (IQ1) | 4.8% | 7.0% |
| Interquartile 75% (IQ3) | 7.3% | 10.7% |
| Interquartile Range (IQR) | 2.5% | 3.7% |
| Standard Deviation (Sample) | 4.1% | 7.1% |
| Standard Deviation (Population) | 4.1% | 7.1% |
Similar Demographics by Disability Age 35 to 64
Demographics Similar to Iranians by Disability Age 35 to 64
In terms of disability age 35 to 64, the demographic groups most similar to Iranians are Immigrants from China (8.7%, a difference of 0.43%), Immigrants from Israel (8.6%, a difference of 0.58%), Immigrants from Bolivia (8.7%, a difference of 0.70%), Thai (8.6%, a difference of 1.0%), and Immigrants from Eastern Asia (8.8%, a difference of 1.4%).
| Demographics | Rating | Rank | Disability Age 35 to 64 |
| Immigrants | Taiwan | 100.0 /100 | #1 | Exceptional 7.8% |
| Filipinos | 100.0 /100 | #2 | Exceptional 8.0% |
| Immigrants | Hong Kong | 100.0 /100 | #3 | Exceptional 8.2% |
| Immigrants | India | 100.0 /100 | #4 | Exceptional 8.3% |
| Immigrants | Iran | 100.0 /100 | #5 | Exceptional 8.5% |
| Thais | 100.0 /100 | #6 | Exceptional 8.6% |
| Immigrants | Israel | 100.0 /100 | #7 | Exceptional 8.6% |
| Iranians | 100.0 /100 | #8 | Exceptional 8.7% |
| Immigrants | China | 100.0 /100 | #9 | Exceptional 8.7% |
| Immigrants | Bolivia | 100.0 /100 | #10 | Exceptional 8.7% |
| Immigrants | Eastern Asia | 100.0 /100 | #11 | Exceptional 8.8% |
| Indians (Asian) | 100.0 /100 | #12 | Exceptional 8.9% |
| Immigrants | South Central Asia | 100.0 /100 | #13 | Exceptional 8.9% |
| Immigrants | Singapore | 100.0 /100 | #14 | Exceptional 8.9% |
| Bolivians | 100.0 /100 | #15 | Exceptional 8.9% |
Demographics Similar to Immigrants from Greece by Disability Age 35 to 64
In terms of disability age 35 to 64, the demographic groups most similar to Immigrants from Greece are Immigrants from Serbia (9.8%, a difference of 0.040%), Immigrants from Belgium (9.8%, a difference of 0.050%), Paraguayan (9.8%, a difference of 0.070%), Cambodian (9.8%, a difference of 0.11%), and Bhutanese (9.8%, a difference of 0.15%).
| Demographics | Rating | Rank | Disability Age 35 to 64 |
| Immigrants | Malaysia | 99.9 /100 | #42 | Exceptional 9.7% |
| Immigrants | Colombia | 99.9 /100 | #43 | Exceptional 9.8% |
| Immigrants | Egypt | 99.9 /100 | #44 | Exceptional 9.8% |
| Immigrants | Peru | 99.9 /100 | #45 | Exceptional 9.8% |
| Cambodians | 99.8 /100 | #46 | Exceptional 9.8% |
| Immigrants | Belgium | 99.8 /100 | #47 | Exceptional 9.8% |
| Immigrants | Serbia | 99.8 /100 | #48 | Exceptional 9.8% |
| Immigrants | Greece | 99.8 /100 | #49 | Exceptional 9.8% |
| Paraguayans | 99.8 /100 | #50 | Exceptional 9.8% |
| Bhutanese | 99.8 /100 | #51 | Exceptional 9.8% |
| Immigrants | Bulgaria | 99.8 /100 | #52 | Exceptional 9.8% |
| Taiwanese | 99.8 /100 | #53 | Exceptional 9.8% |
| Immigrants | Russia | 99.8 /100 | #54 | Exceptional 9.8% |
| Peruvians | 99.8 /100 | #55 | Exceptional 9.9% |
| South Americans | 99.8 /100 | #56 | Exceptional 9.9% |