Ghanaian vs Pennsylvania German Ambulatory Disability
COMPARE
Ghanaian
Pennsylvania German
Ambulatory Disability
Ambulatory Disability Comparison
Ghanaians
Pennsylvania Germans
6.0%
AMBULATORY DISABILITY
71.3/ 100
METRIC RATING
157th/ 347
METRIC RANK
6.8%
AMBULATORY DISABILITY
0.0/ 100
METRIC RATING
280th/ 347
METRIC RANK
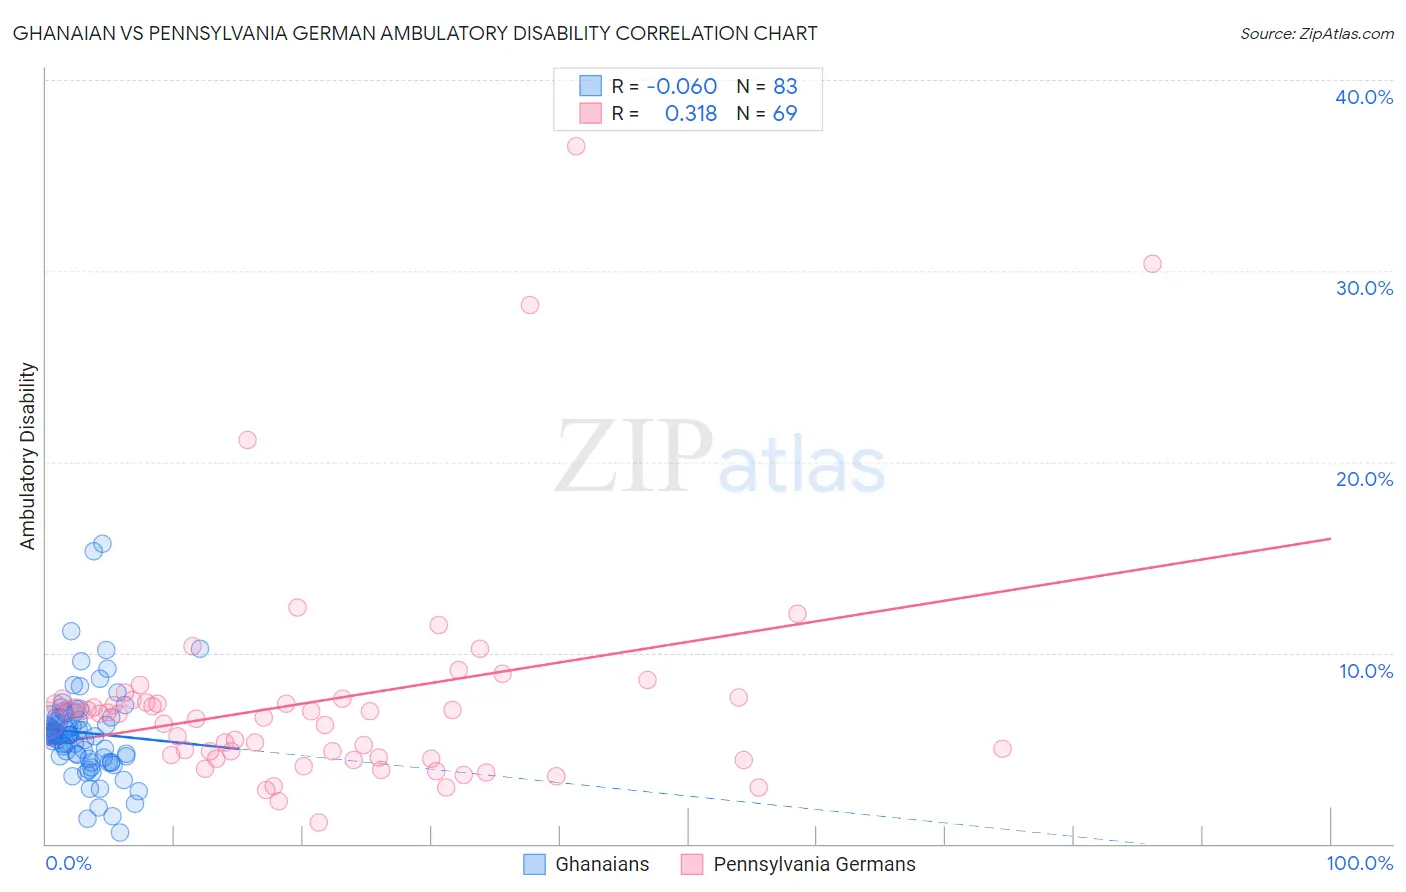
Ghanaian vs Pennsylvania German Ambulatory Disability Correlation Chart
The statistical analysis conducted on geographies consisting of 190,643,390 people shows a slight negative correlation between the proportion of Ghanaians and percentage of population with ambulatory disability in the United States with a correlation coefficient (R) of -0.060 and weighted average of 6.0%. Similarly, the statistical analysis conducted on geographies consisting of 234,073,505 people shows a mild positive correlation between the proportion of Pennsylvania Germans and percentage of population with ambulatory disability in the United States with a correlation coefficient (R) of 0.318 and weighted average of 6.8%, a difference of 11.7%.
Ambulatory Disability Correlation Summary
| Measurement | Ghanaian | Pennsylvania German |
| Minimum | 0.61% | 1.1% |
| Maximum | 15.7% | 36.5% |
| Range | 15.1% | 35.4% |
| Mean | 5.8% | 7.5% |
| Median | 5.7% | 6.8% |
| Interquartile 25% (IQ1) | 4.5% | 4.5% |
| Interquartile 75% (IQ3) | 6.6% | 7.5% |
| Interquartile Range (IQR) | 2.1% | 3.1% |
| Standard Deviation (Sample) | 2.5% | 6.0% |
| Standard Deviation (Population) | 2.4% | 5.9% |
Similar Demographics by Ambulatory Disability
Demographics Similar to Ghanaians by Ambulatory Disability
In terms of ambulatory disability, the demographic groups most similar to Ghanaians are Immigrants from Fiji (6.0%, a difference of 0.010%), Immigrants from Latvia (6.0%, a difference of 0.020%), Northern European (6.0%, a difference of 0.030%), Immigrants from Scotland (6.0%, a difference of 0.050%), and Central American (6.0%, a difference of 0.10%).
| Demographics | Rating | Rank | Ambulatory Disability |
| Maltese | 81.6 /100 | #150 | Excellent 6.0% |
| Greeks | 79.6 /100 | #151 | Good 6.0% |
| Immigrants | Austria | 78.8 /100 | #152 | Good 6.0% |
| Syrians | 75.5 /100 | #153 | Good 6.0% |
| Immigrants | Croatia | 75.1 /100 | #154 | Good 6.0% |
| Immigrants | Scotland | 72.1 /100 | #155 | Good 6.0% |
| Northern Europeans | 71.8 /100 | #156 | Good 6.0% |
| Ghanaians | 71.3 /100 | #157 | Good 6.0% |
| Immigrants | Fiji | 71.2 /100 | #158 | Good 6.0% |
| Immigrants | Latvia | 71.1 /100 | #159 | Good 6.0% |
| Central Americans | 69.8 /100 | #160 | Good 6.0% |
| Immigrants | Belarus | 69.2 /100 | #161 | Good 6.1% |
| Nigerians | 67.1 /100 | #162 | Good 6.1% |
| Lebanese | 66.2 /100 | #163 | Good 6.1% |
| Basques | 63.7 /100 | #164 | Good 6.1% |
Demographics Similar to Pennsylvania Germans by Ambulatory Disability
In terms of ambulatory disability, the demographic groups most similar to Pennsylvania Germans are Yaqui (6.8%, a difference of 0.070%), Immigrants from Caribbean (6.7%, a difference of 0.10%), Barbadian (6.8%, a difference of 0.20%), Immigrants from Barbados (6.8%, a difference of 0.36%), and Immigrants from West Indies (6.7%, a difference of 0.41%).
| Demographics | Rating | Rank | Ambulatory Disability |
| Whites/Caucasians | 0.1 /100 | #273 | Tragic 6.7% |
| Sioux | 0.1 /100 | #274 | Tragic 6.7% |
| Immigrants | Guyana | 0.1 /100 | #275 | Tragic 6.7% |
| Celtics | 0.1 /100 | #276 | Tragic 6.7% |
| Jamaicans | 0.1 /100 | #277 | Tragic 6.7% |
| Immigrants | West Indies | 0.1 /100 | #278 | Tragic 6.7% |
| Immigrants | Caribbean | 0.0 /100 | #279 | Tragic 6.7% |
| Pennsylvania Germans | 0.0 /100 | #280 | Tragic 6.8% |
| Yaqui | 0.0 /100 | #281 | Tragic 6.8% |
| Barbadians | 0.0 /100 | #282 | Tragic 6.8% |
| Immigrants | Barbados | 0.0 /100 | #283 | Tragic 6.8% |
| Immigrants | Jamaica | 0.0 /100 | #284 | Tragic 6.8% |
| Fijians | 0.0 /100 | #285 | Tragic 6.8% |
| Yakama | 0.0 /100 | #286 | Tragic 6.8% |
| U.S. Virgin Islanders | 0.0 /100 | #287 | Tragic 6.8% |