Immigrants from Guyana vs Navajo Male Disability
COMPARE
Immigrants from Guyana
Navajo
Male Disability
Male Disability Comparison
Immigrants from Guyana
Navajo
10.6%
MALE DISABILITY
98.2/ 100
METRIC RATING
82nd/ 347
METRIC RANK
14.4%
MALE DISABILITY
0.0/ 100
METRIC RATING
330th/ 347
METRIC RANK
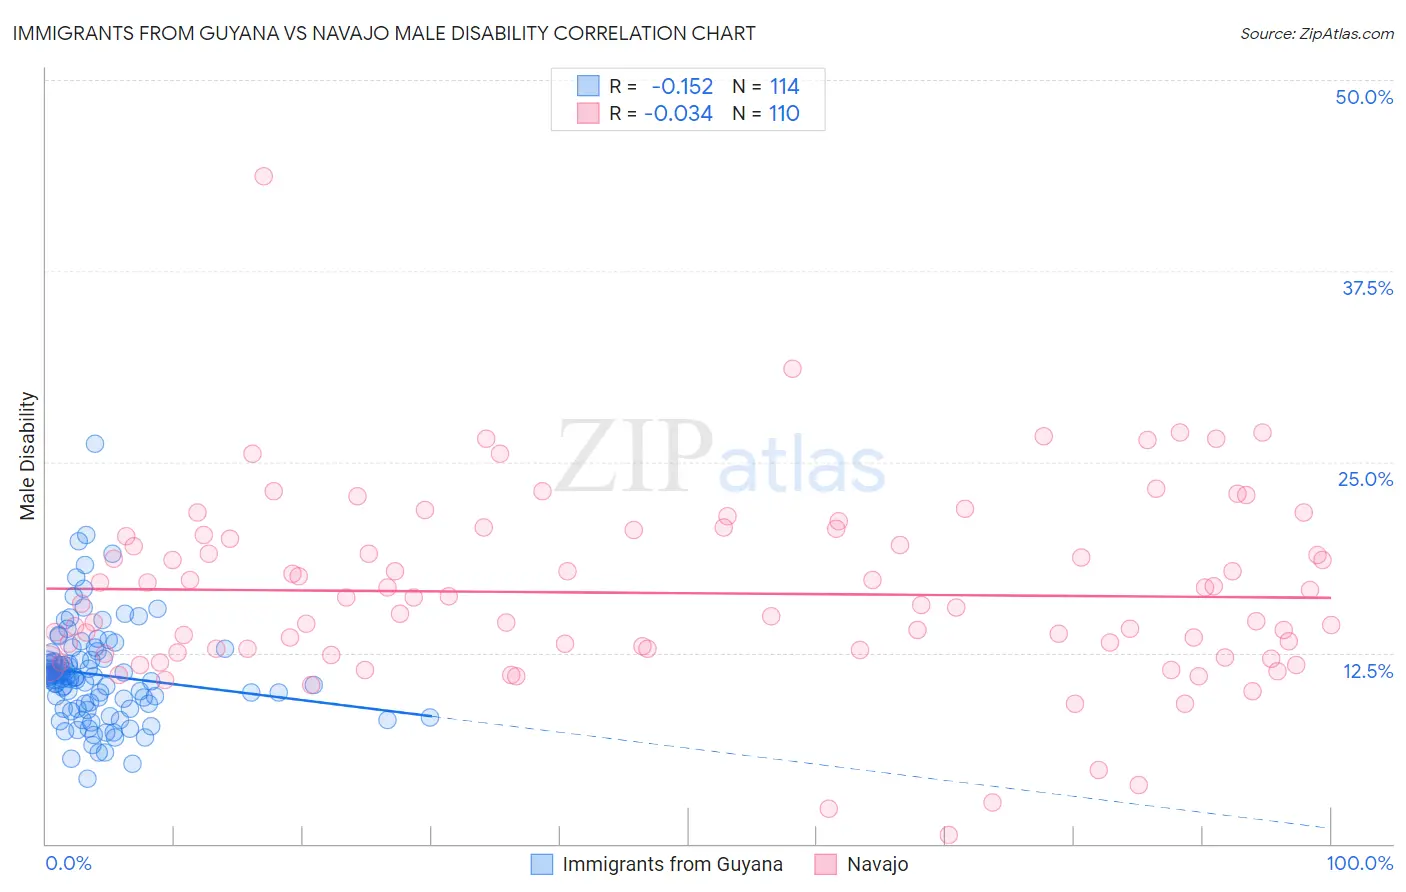
Immigrants from Guyana vs Navajo Male Disability Correlation Chart
The statistical analysis conducted on geographies consisting of 183,704,199 people shows a poor negative correlation between the proportion of Immigrants from Guyana and percentage of males with a disability in the United States with a correlation coefficient (R) of -0.152 and weighted average of 10.6%. Similarly, the statistical analysis conducted on geographies consisting of 224,784,363 people shows no correlation between the proportion of Navajo and percentage of males with a disability in the United States with a correlation coefficient (R) of -0.034 and weighted average of 14.4%, a difference of 35.9%.
Male Disability Correlation Summary
| Measurement | Immigrants from Guyana | Navajo |
| Minimum | 4.3% | 0.60% |
| Maximum | 26.1% | 43.7% |
| Range | 21.9% | 43.1% |
| Mean | 11.1% | 16.4% |
| Median | 10.9% | 15.6% |
| Interquartile 25% (IQ1) | 9.1% | 12.7% |
| Interquartile 75% (IQ3) | 12.1% | 20.1% |
| Interquartile Range (IQR) | 2.9% | 7.5% |
| Standard Deviation (Sample) | 3.3% | 6.1% |
| Standard Deviation (Population) | 3.3% | 6.1% |
Similar Demographics by Male Disability
Demographics Similar to Immigrants from Guyana by Male Disability
In terms of male disability, the demographic groups most similar to Immigrants from Guyana are Immigrants from Poland (10.6%, a difference of 0.060%), Immigrants from Chile (10.6%, a difference of 0.070%), Bulgarian (10.6%, a difference of 0.080%), Immigrants from Jordan (10.6%, a difference of 0.13%), and Zimbabwean (10.6%, a difference of 0.15%).
| Demographics | Rating | Rank | Male Disability |
| Sierra Leoneans | 98.7 /100 | #75 | Exceptional 10.5% |
| Immigrants | Sierra Leone | 98.7 /100 | #76 | Exceptional 10.5% |
| Laotians | 98.6 /100 | #77 | Exceptional 10.6% |
| Immigrants | Russia | 98.6 /100 | #78 | Exceptional 10.6% |
| Zimbabweans | 98.4 /100 | #79 | Exceptional 10.6% |
| Immigrants | Jordan | 98.4 /100 | #80 | Exceptional 10.6% |
| Immigrants | Chile | 98.3 /100 | #81 | Exceptional 10.6% |
| Immigrants | Guyana | 98.2 /100 | #82 | Exceptional 10.6% |
| Immigrants | Poland | 98.1 /100 | #83 | Exceptional 10.6% |
| Bulgarians | 98.1 /100 | #84 | Exceptional 10.6% |
| Sri Lankans | 97.9 /100 | #85 | Exceptional 10.6% |
| Immigrants | Ireland | 97.9 /100 | #86 | Exceptional 10.6% |
| Immigrants | Vietnam | 97.9 /100 | #87 | Exceptional 10.6% |
| Immigrants | Western Asia | 97.8 /100 | #88 | Exceptional 10.6% |
| Immigrants | Nicaragua | 97.8 /100 | #89 | Exceptional 10.6% |
Demographics Similar to Navajo by Male Disability
In terms of male disability, the demographic groups most similar to Navajo are Cajun (14.4%, a difference of 0.23%), Chippewa (14.3%, a difference of 0.81%), Potawatomi (14.2%, a difference of 1.2%), Native/Alaskan (14.2%, a difference of 1.3%), and Tohono O'odham (14.6%, a difference of 1.5%).
| Demographics | Rating | Rank | Male Disability |
| Osage | 0.0 /100 | #323 | Tragic 14.0% |
| Comanche | 0.0 /100 | #324 | Tragic 14.1% |
| Ottawa | 0.0 /100 | #325 | Tragic 14.1% |
| Natives/Alaskans | 0.0 /100 | #326 | Tragic 14.2% |
| Potawatomi | 0.0 /100 | #327 | Tragic 14.2% |
| Chippewa | 0.0 /100 | #328 | Tragic 14.3% |
| Cajuns | 0.0 /100 | #329 | Tragic 14.4% |
| Navajo | 0.0 /100 | #330 | Tragic 14.4% |
| Tohono O'odham | 0.0 /100 | #331 | Tragic 14.6% |
| Seminole | 0.0 /100 | #332 | Tragic 14.7% |
| Yuman | 0.0 /100 | #333 | Tragic 14.7% |
| Cherokee | 0.0 /100 | #334 | Tragic 14.8% |
| Dutch West Indians | 0.0 /100 | #335 | Tragic 14.8% |
| Alaskan Athabascans | 0.0 /100 | #336 | Tragic 14.9% |
| Menominee | 0.0 /100 | #337 | Tragic 15.0% |