Immigrants from Guatemala vs Navajo Male Disability
COMPARE
Immigrants from Guatemala
Navajo
Male Disability
Male Disability Comparison
Immigrants from Guatemala
Navajo
11.0%
MALE DISABILITY
75.1/ 100
METRIC RATING
150th/ 347
METRIC RANK
14.4%
MALE DISABILITY
0.0/ 100
METRIC RATING
330th/ 347
METRIC RANK
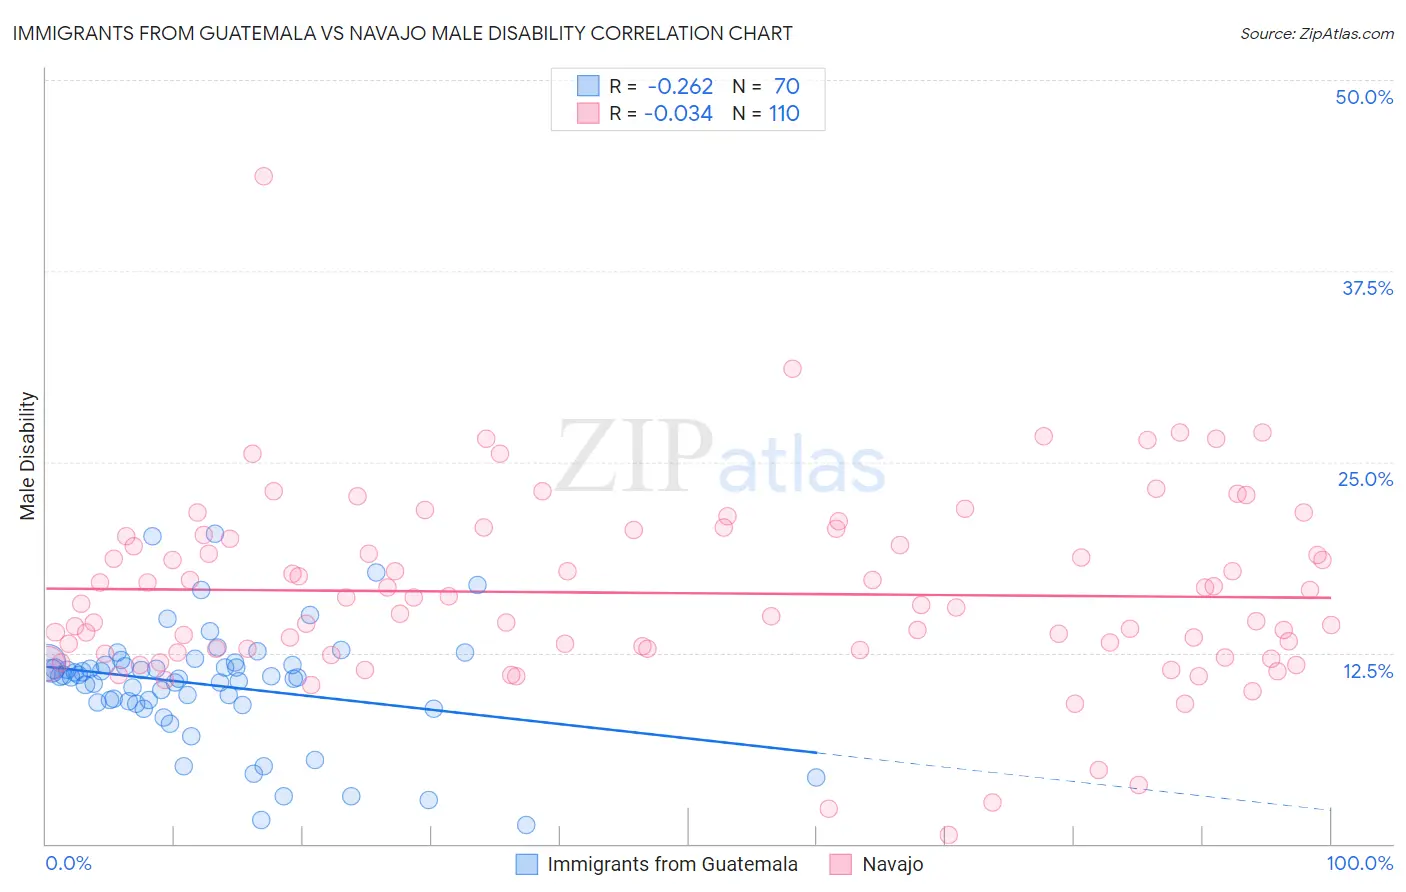
Immigrants from Guatemala vs Navajo Male Disability Correlation Chart
The statistical analysis conducted on geographies consisting of 377,223,661 people shows a weak negative correlation between the proportion of Immigrants from Guatemala and percentage of males with a disability in the United States with a correlation coefficient (R) of -0.262 and weighted average of 11.0%. Similarly, the statistical analysis conducted on geographies consisting of 224,784,363 people shows no correlation between the proportion of Navajo and percentage of males with a disability in the United States with a correlation coefficient (R) of -0.034 and weighted average of 14.4%, a difference of 30.3%.
Male Disability Correlation Summary
| Measurement | Immigrants from Guatemala | Navajo |
| Minimum | 1.3% | 0.60% |
| Maximum | 20.3% | 43.7% |
| Range | 19.1% | 43.1% |
| Mean | 10.4% | 16.4% |
| Median | 10.9% | 15.6% |
| Interquartile 25% (IQ1) | 9.2% | 12.7% |
| Interquartile 75% (IQ3) | 11.7% | 20.1% |
| Interquartile Range (IQR) | 2.5% | 7.5% |
| Standard Deviation (Sample) | 3.7% | 6.1% |
| Standard Deviation (Population) | 3.7% | 6.1% |
Similar Demographics by Male Disability
Demographics Similar to Immigrants from Guatemala by Male Disability
In terms of male disability, the demographic groups most similar to Immigrants from Guatemala are Cuban (11.0%, a difference of 0.020%), Immigrants from Albania (11.0%, a difference of 0.050%), Immigrants from Denmark (11.0%, a difference of 0.10%), Immigrants from Northern Europe (11.1%, a difference of 0.14%), and Sudanese (11.0%, a difference of 0.15%).
| Demographics | Rating | Rank | Male Disability |
| Moroccans | 80.7 /100 | #143 | Excellent 11.0% |
| Kenyans | 78.1 /100 | #144 | Good 11.0% |
| Costa Ricans | 78.0 /100 | #145 | Good 11.0% |
| Koreans | 77.5 /100 | #146 | Good 11.0% |
| Immigrants | Croatia | 77.3 /100 | #147 | Good 11.0% |
| Sudanese | 77.1 /100 | #148 | Good 11.0% |
| Immigrants | Denmark | 76.4 /100 | #149 | Good 11.0% |
| Immigrants | Guatemala | 75.1 /100 | #150 | Good 11.0% |
| Cubans | 74.9 /100 | #151 | Good 11.0% |
| Immigrants | Albania | 74.4 /100 | #152 | Good 11.0% |
| Immigrants | Northern Europe | 73.2 /100 | #153 | Good 11.1% |
| Immigrants | Moldova | 72.8 /100 | #154 | Good 11.1% |
| Immigrants | Middle Africa | 70.9 /100 | #155 | Good 11.1% |
| Russians | 69.8 /100 | #156 | Good 11.1% |
| Immigrants | Western Africa | 69.2 /100 | #157 | Good 11.1% |
Demographics Similar to Navajo by Male Disability
In terms of male disability, the demographic groups most similar to Navajo are Cajun (14.4%, a difference of 0.23%), Chippewa (14.3%, a difference of 0.81%), Potawatomi (14.2%, a difference of 1.2%), Native/Alaskan (14.2%, a difference of 1.3%), and Tohono O'odham (14.6%, a difference of 1.5%).
| Demographics | Rating | Rank | Male Disability |
| Osage | 0.0 /100 | #323 | Tragic 14.0% |
| Comanche | 0.0 /100 | #324 | Tragic 14.1% |
| Ottawa | 0.0 /100 | #325 | Tragic 14.1% |
| Natives/Alaskans | 0.0 /100 | #326 | Tragic 14.2% |
| Potawatomi | 0.0 /100 | #327 | Tragic 14.2% |
| Chippewa | 0.0 /100 | #328 | Tragic 14.3% |
| Cajuns | 0.0 /100 | #329 | Tragic 14.4% |
| Navajo | 0.0 /100 | #330 | Tragic 14.4% |
| Tohono O'odham | 0.0 /100 | #331 | Tragic 14.6% |
| Seminole | 0.0 /100 | #332 | Tragic 14.7% |
| Yuman | 0.0 /100 | #333 | Tragic 14.7% |
| Cherokee | 0.0 /100 | #334 | Tragic 14.8% |
| Dutch West Indians | 0.0 /100 | #335 | Tragic 14.8% |
| Alaskan Athabascans | 0.0 /100 | #336 | Tragic 14.9% |
| Menominee | 0.0 /100 | #337 | Tragic 15.0% |