Iranian vs Immigrants from Greece 5th Grade
COMPARE
Iranian
Immigrants from Greece
5th Grade
5th Grade Comparison
Iranians
Immigrants from Greece
97.9%
5TH GRADE
99.5/ 100
METRIC RATING
70th/ 347
METRIC RANK
97.5%
5TH GRADE
83.2/ 100
METRIC RATING
144th/ 347
METRIC RANK
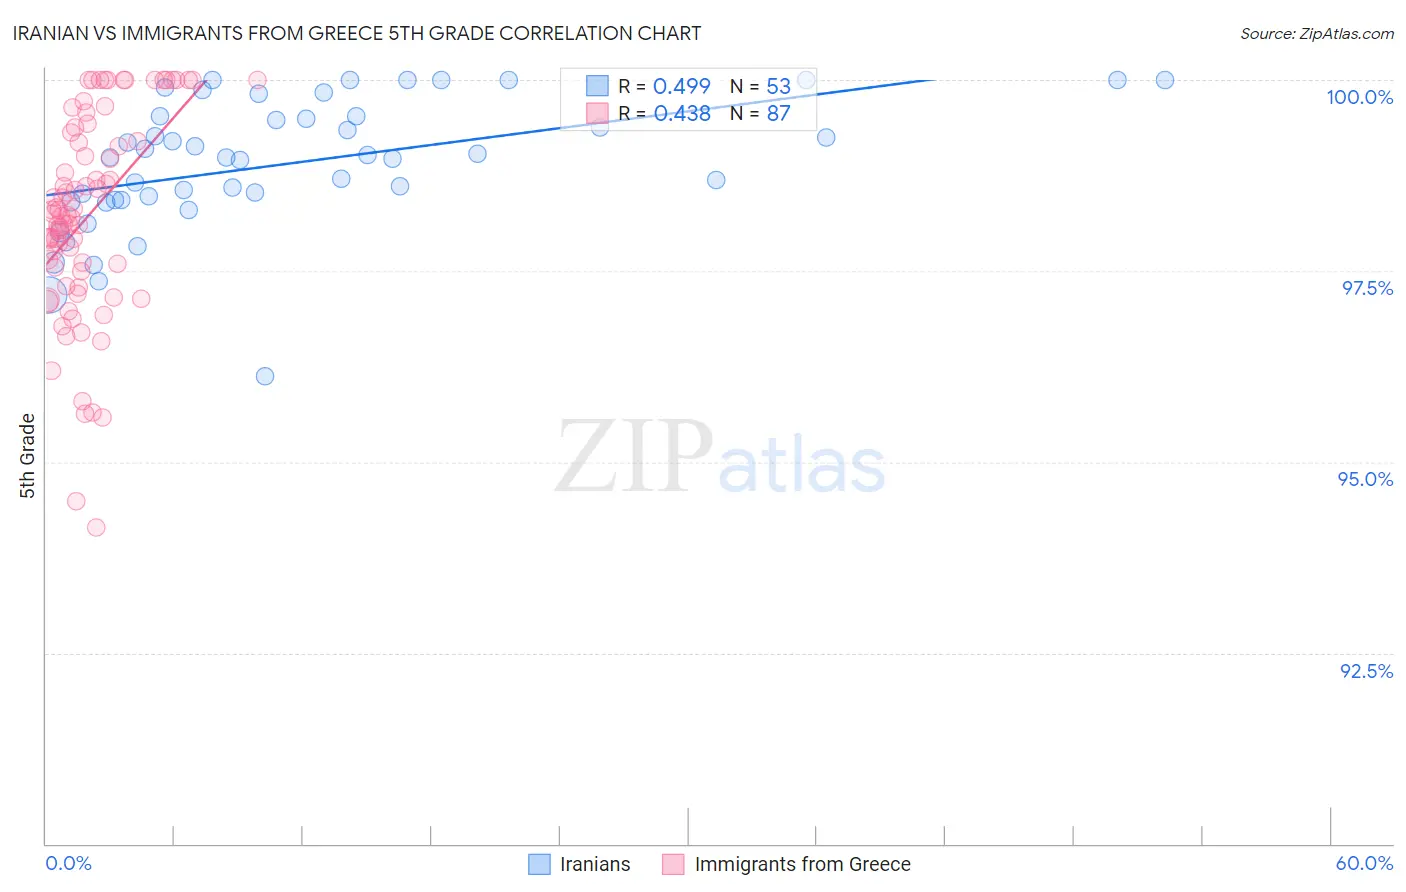
Iranian vs Immigrants from Greece 5th Grade Correlation Chart
The statistical analysis conducted on geographies consisting of 310,636,461 people shows a moderate positive correlation between the proportion of Iranians and percentage of population with at least 5th grade education in the United States with a correlation coefficient (R) of 0.499 and weighted average of 97.9%. Similarly, the statistical analysis conducted on geographies consisting of 216,879,847 people shows a moderate positive correlation between the proportion of Immigrants from Greece and percentage of population with at least 5th grade education in the United States with a correlation coefficient (R) of 0.438 and weighted average of 97.5%, a difference of 0.38%.
5th Grade Correlation Summary
| Measurement | Iranian | Immigrants from Greece |
| Minimum | 96.1% | 94.1% |
| Maximum | 100.0% | 100.0% |
| Range | 3.9% | 5.9% |
| Mean | 98.9% | 98.2% |
| Median | 99.0% | 98.2% |
| Interquartile 25% (IQ1) | 98.4% | 97.5% |
| Interquartile 75% (IQ3) | 99.5% | 99.3% |
| Interquartile Range (IQR) | 1.1% | 1.8% |
| Standard Deviation (Sample) | 0.86% | 1.3% |
| Standard Deviation (Population) | 0.85% | 1.3% |
Similar Demographics by 5th Grade
Demographics Similar to Iranians by 5th Grade
In terms of 5th grade, the demographic groups most similar to Iranians are Chickasaw (97.9%, a difference of 0.0%), Kiowa (97.9%, a difference of 0.010%), Macedonian (97.9%, a difference of 0.010%), Cajun (97.9%, a difference of 0.020%), and Cherokee (97.8%, a difference of 0.020%).
| Demographics | Rating | Rank | 5th Grade |
| Russians | 99.7 /100 | #63 | Exceptional 97.9% |
| Immigrants | Northern Europe | 99.6 /100 | #64 | Exceptional 97.9% |
| Canadians | 99.6 /100 | #65 | Exceptional 97.9% |
| Immigrants | Austria | 99.6 /100 | #66 | Exceptional 97.9% |
| New Zealanders | 99.6 /100 | #67 | Exceptional 97.9% |
| Cajuns | 99.6 /100 | #68 | Exceptional 97.9% |
| Kiowa | 99.5 /100 | #69 | Exceptional 97.9% |
| Iranians | 99.5 /100 | #70 | Exceptional 97.9% |
| Chickasaw | 99.5 /100 | #71 | Exceptional 97.9% |
| Macedonians | 99.4 /100 | #72 | Exceptional 97.9% |
| Cherokee | 99.4 /100 | #73 | Exceptional 97.8% |
| Lumbee | 99.3 /100 | #74 | Exceptional 97.8% |
| Ukrainians | 99.3 /100 | #75 | Exceptional 97.8% |
| Immigrants | Netherlands | 99.3 /100 | #76 | Exceptional 97.8% |
| Immigrants | England | 99.3 /100 | #77 | Exceptional 97.8% |
Demographics Similar to Immigrants from Greece by 5th Grade
In terms of 5th grade, the demographic groups most similar to Immigrants from Greece are Jordanian (97.5%, a difference of 0.0%), Spaniard (97.5%, a difference of 0.010%), Soviet Union (97.5%, a difference of 0.010%), Burmese (97.5%, a difference of 0.020%), and Seminole (97.5%, a difference of 0.020%).
| Demographics | Rating | Rank | 5th Grade |
| Filipinos | 86.8 /100 | #137 | Excellent 97.5% |
| Blackfeet | 86.8 /100 | #138 | Excellent 97.5% |
| Immigrants | Turkey | 86.7 /100 | #139 | Excellent 97.5% |
| Burmese | 86.1 /100 | #140 | Excellent 97.5% |
| Seminole | 85.8 /100 | #141 | Excellent 97.5% |
| Israelis | 85.5 /100 | #142 | Excellent 97.5% |
| Immigrants | North Macedonia | 85.4 /100 | #143 | Excellent 97.5% |
| Immigrants | Greece | 83.2 /100 | #144 | Excellent 97.5% |
| Jordanians | 82.6 /100 | #145 | Excellent 97.5% |
| Spaniards | 81.9 /100 | #146 | Excellent 97.5% |
| Soviet Union | 81.2 /100 | #147 | Excellent 97.5% |
| Immigrants | Israel | 79.1 /100 | #148 | Good 97.5% |
| Hopi | 78.6 /100 | #149 | Good 97.5% |
| Immigrants | South Central Asia | 78.6 /100 | #150 | Good 97.5% |
| Immigrants | Eastern Europe | 75.0 /100 | #151 | Good 97.4% |