Iranian vs Immigrants from Greece Professional Degree
COMPARE
Iranian
Immigrants from Greece
Professional Degree
Professional Degree Comparison
Iranians
Immigrants from Greece
7.6%
PROFESSIONAL DEGREE
100.0/ 100
METRIC RATING
3rd/ 347
METRIC RANK
5.8%
PROFESSIONAL DEGREE
100.0/ 100
METRIC RATING
51st/ 347
METRIC RANK
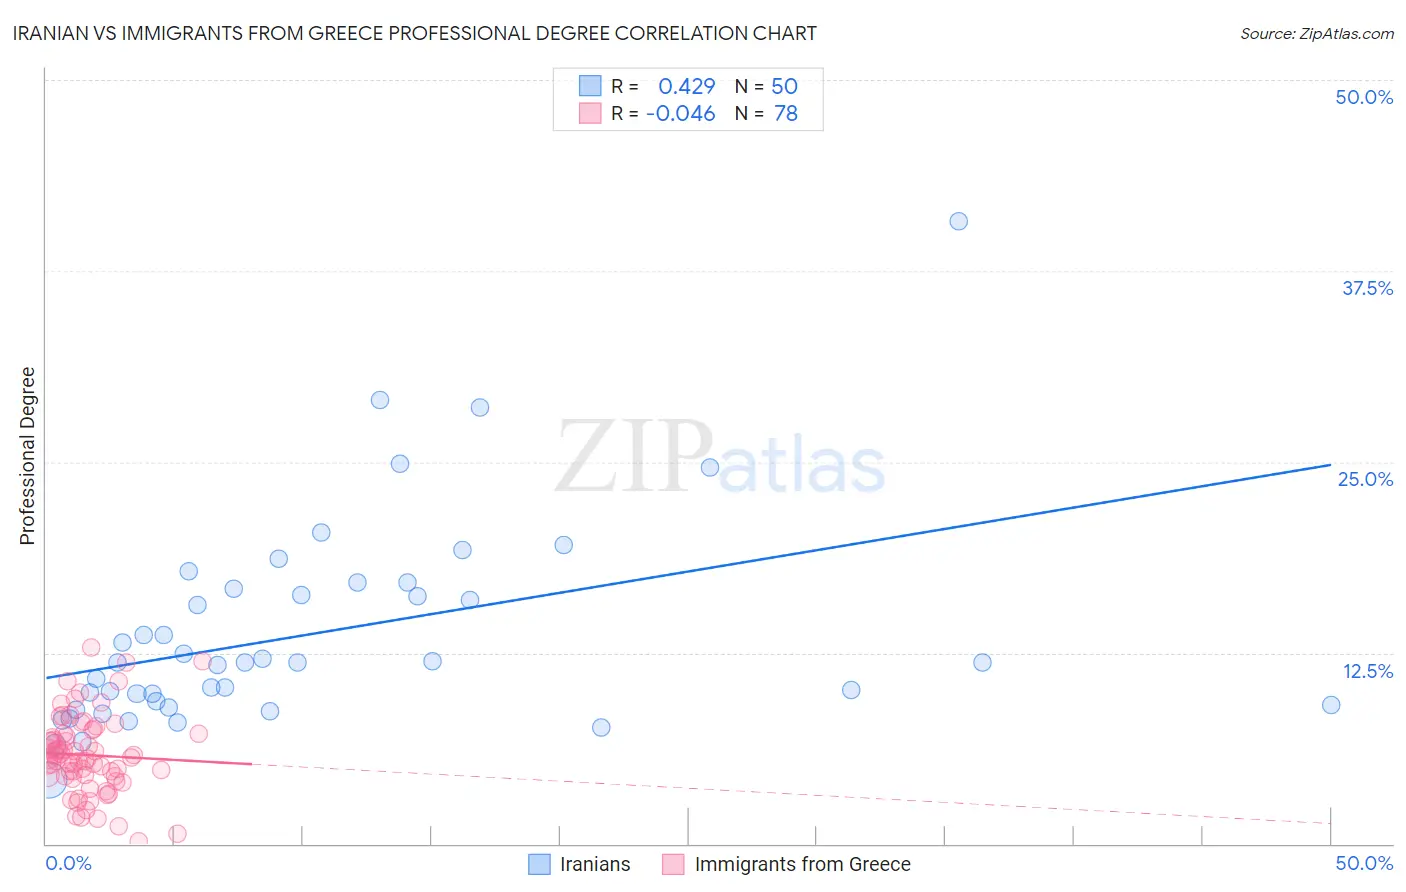
Iranian vs Immigrants from Greece Professional Degree Correlation Chart
The statistical analysis conducted on geographies consisting of 316,586,125 people shows a moderate positive correlation between the proportion of Iranians and percentage of population with at least professional degree education in the United States with a correlation coefficient (R) of 0.429 and weighted average of 7.6%. Similarly, the statistical analysis conducted on geographies consisting of 216,830,779 people shows no correlation between the proportion of Immigrants from Greece and percentage of population with at least professional degree education in the United States with a correlation coefficient (R) of -0.046 and weighted average of 5.8%, a difference of 31.0%.
Professional Degree Correlation Summary
| Measurement | Iranian | Immigrants from Greece |
| Minimum | 4.2% | 0.18% |
| Maximum | 40.7% | 12.8% |
| Range | 36.6% | 12.6% |
| Mean | 13.7% | 5.8% |
| Median | 11.9% | 5.6% |
| Interquartile 25% (IQ1) | 9.1% | 4.4% |
| Interquartile 75% (IQ3) | 16.7% | 7.2% |
| Interquartile Range (IQR) | 7.6% | 2.8% |
| Standard Deviation (Sample) | 6.8% | 2.6% |
| Standard Deviation (Population) | 6.7% | 2.5% |
Similar Demographics by Professional Degree
Demographics Similar to Iranians by Professional Degree
In terms of professional degree, the demographic groups most similar to Iranians are Filipino (7.6%, a difference of 0.77%), Immigrants from Singapore (7.7%, a difference of 1.6%), Immigrants from Israel (7.9%, a difference of 3.1%), Immigrants from Iran (7.3%, a difference of 4.0%), and Okinawan (7.3%, a difference of 4.2%).
| Demographics | Rating | Rank | Professional Degree |
| Immigrants | Israel | 100.0 /100 | #1 | Exceptional 7.9% |
| Immigrants | Singapore | 100.0 /100 | #2 | Exceptional 7.7% |
| Iranians | 100.0 /100 | #3 | Exceptional 7.6% |
| Filipinos | 100.0 /100 | #4 | Exceptional 7.6% |
| Immigrants | Iran | 100.0 /100 | #5 | Exceptional 7.3% |
| Okinawans | 100.0 /100 | #6 | Exceptional 7.3% |
| Eastern Europeans | 100.0 /100 | #7 | Exceptional 7.1% |
| Immigrants | Switzerland | 100.0 /100 | #8 | Exceptional 7.1% |
| Immigrants | Taiwan | 100.0 /100 | #9 | Exceptional 7.1% |
| Immigrants | Belgium | 100.0 /100 | #10 | Exceptional 7.0% |
| Cypriots | 100.0 /100 | #11 | Exceptional 6.9% |
| Israelis | 100.0 /100 | #12 | Exceptional 6.9% |
| Immigrants | Australia | 100.0 /100 | #13 | Exceptional 6.9% |
| Immigrants | France | 100.0 /100 | #14 | Exceptional 6.8% |
| Immigrants | China | 100.0 /100 | #15 | Exceptional 6.7% |
Demographics Similar to Immigrants from Greece by Professional Degree
In terms of professional degree, the demographic groups most similar to Immigrants from Greece are Immigrants from Czechoslovakia (5.8%, a difference of 0.060%), Immigrants from Serbia (5.8%, a difference of 0.070%), Immigrants from Netherlands (5.8%, a difference of 0.30%), Immigrants from Latvia (5.8%, a difference of 0.38%), and Paraguayan (5.9%, a difference of 0.78%).
| Demographics | Rating | Rank | Professional Degree |
| Argentineans | 100.0 /100 | #44 | Exceptional 5.9% |
| Immigrants | South Central Asia | 100.0 /100 | #45 | Exceptional 5.9% |
| Immigrants | Argentina | 100.0 /100 | #46 | Exceptional 5.9% |
| Australians | 100.0 /100 | #47 | Exceptional 5.9% |
| Paraguayans | 100.0 /100 | #48 | Exceptional 5.9% |
| Immigrants | Latvia | 100.0 /100 | #49 | Exceptional 5.8% |
| Immigrants | Czechoslovakia | 100.0 /100 | #50 | Exceptional 5.8% |
| Immigrants | Greece | 100.0 /100 | #51 | Exceptional 5.8% |
| Immigrants | Serbia | 100.0 /100 | #52 | Exceptional 5.8% |
| Immigrants | Netherlands | 100.0 /100 | #53 | Exceptional 5.8% |
| Immigrants | Kuwait | 100.0 /100 | #54 | Exceptional 5.7% |
| Immigrants | Western Europe | 100.0 /100 | #55 | Exceptional 5.7% |
| Immigrants | Malaysia | 100.0 /100 | #56 | Exceptional 5.7% |
| South Africans | 100.0 /100 | #57 | Exceptional 5.7% |
| Bulgarians | 100.0 /100 | #58 | Exceptional 5.7% |