Inupiat vs Immigrants from Greece Cognitive Disability
COMPARE
Inupiat
Immigrants from Greece
Cognitive Disability
Cognitive Disability Comparison
Inupiat
Immigrants from Greece
16.9%
COGNITIVE DISABILITY
96.5/ 100
METRIC RATING
116th/ 347
METRIC RANK
16.3%
COGNITIVE DISABILITY
100.0/ 100
METRIC RATING
15th/ 347
METRIC RANK
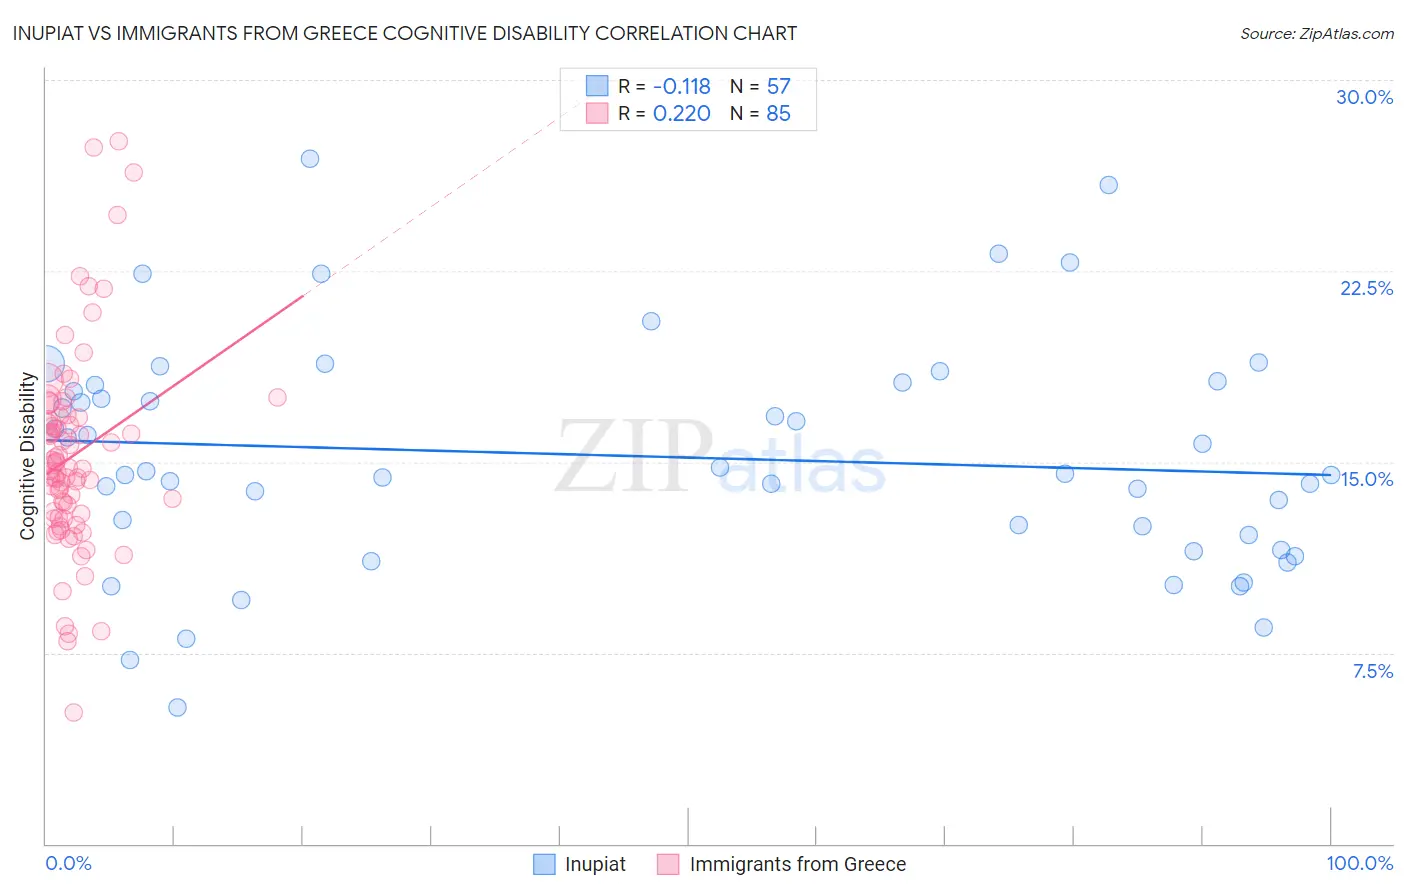
Inupiat vs Immigrants from Greece Cognitive Disability Correlation Chart
The statistical analysis conducted on geographies consisting of 96,337,062 people shows a poor negative correlation between the proportion of Inupiat and percentage of population with cognitive disability in the United States with a correlation coefficient (R) of -0.118 and weighted average of 16.9%. Similarly, the statistical analysis conducted on geographies consisting of 216,873,131 people shows a weak positive correlation between the proportion of Immigrants from Greece and percentage of population with cognitive disability in the United States with a correlation coefficient (R) of 0.220 and weighted average of 16.3%, a difference of 3.7%.
Cognitive Disability Correlation Summary
| Measurement | Inupiat | Immigrants from Greece |
| Minimum | 5.4% | 5.2% |
| Maximum | 26.9% | 27.6% |
| Range | 21.6% | 22.4% |
| Mean | 15.2% | 15.3% |
| Median | 14.5% | 14.8% |
| Interquartile 25% (IQ1) | 11.8% | 12.9% |
| Interquartile 75% (IQ3) | 18.1% | 16.8% |
| Interquartile Range (IQR) | 6.2% | 3.9% |
| Standard Deviation (Sample) | 4.5% | 4.0% |
| Standard Deviation (Population) | 4.5% | 3.9% |
Similar Demographics by Cognitive Disability
Demographics Similar to Inupiat by Cognitive Disability
In terms of cognitive disability, the demographic groups most similar to Inupiat are Immigrants from Japan (16.9%, a difference of 0.050%), Immigrants from Denmark (16.9%, a difference of 0.060%), Yup'ik (16.9%, a difference of 0.10%), Immigrants from Sri Lanka (16.8%, a difference of 0.15%), and Korean (16.8%, a difference of 0.15%).
| Demographics | Rating | Rank | Cognitive Disability |
| Albanians | 97.3 /100 | #109 | Exceptional 16.8% |
| Arapaho | 97.3 /100 | #110 | Exceptional 16.8% |
| Uruguayans | 97.2 /100 | #111 | Exceptional 16.8% |
| Indians (Asian) | 97.2 /100 | #112 | Exceptional 16.8% |
| Immigrants | Sri Lanka | 97.1 /100 | #113 | Exceptional 16.8% |
| Koreans | 97.1 /100 | #114 | Exceptional 16.8% |
| Yup'ik | 96.9 /100 | #115 | Exceptional 16.9% |
| Inupiat | 96.5 /100 | #116 | Exceptional 16.9% |
| Immigrants | Japan | 96.2 /100 | #117 | Exceptional 16.9% |
| Immigrants | Denmark | 96.2 /100 | #118 | Exceptional 16.9% |
| South Africans | 95.5 /100 | #119 | Exceptional 16.9% |
| Scottish | 95.0 /100 | #120 | Exceptional 16.9% |
| Immigrants | China | 94.9 /100 | #121 | Exceptional 16.9% |
| Immigrants | Western Europe | 94.8 /100 | #122 | Exceptional 16.9% |
| Portuguese | 94.7 /100 | #123 | Exceptional 16.9% |
Demographics Similar to Immigrants from Greece by Cognitive Disability
In terms of cognitive disability, the demographic groups most similar to Immigrants from Greece are Immigrants from Austria (16.3%, a difference of 0.030%), Lithuanian (16.3%, a difference of 0.090%), Maltese (16.2%, a difference of 0.18%), Eastern European (16.3%, a difference of 0.29%), and Immigrants from North Macedonia (16.3%, a difference of 0.31%).
| Demographics | Rating | Rank | Cognitive Disability |
| Immigrants | Poland | 100.0 /100 | #8 | Exceptional 16.1% |
| Assyrians/Chaldeans/Syriacs | 100.0 /100 | #9 | Exceptional 16.2% |
| Immigrants | Scotland | 100.0 /100 | #10 | Exceptional 16.2% |
| Immigrants | Czechoslovakia | 100.0 /100 | #11 | Exceptional 16.2% |
| Maltese | 100.0 /100 | #12 | Exceptional 16.2% |
| Lithuanians | 100.0 /100 | #13 | Exceptional 16.3% |
| Immigrants | Austria | 100.0 /100 | #14 | Exceptional 16.3% |
| Immigrants | Greece | 100.0 /100 | #15 | Exceptional 16.3% |
| Eastern Europeans | 100.0 /100 | #16 | Exceptional 16.3% |
| Immigrants | North Macedonia | 100.0 /100 | #17 | Exceptional 16.3% |
| Immigrants | Northern Europe | 100.0 /100 | #18 | Exceptional 16.3% |
| Immigrants | Bolivia | 100.0 /100 | #19 | Exceptional 16.3% |
| Bulgarians | 100.0 /100 | #20 | Exceptional 16.3% |
| Immigrants | Cuba | 100.0 /100 | #21 | Exceptional 16.3% |
| Immigrants | South Central Asia | 99.9 /100 | #22 | Exceptional 16.4% |