Inupiat vs Immigrants from Eastern Europe Cognitive Disability
COMPARE
Inupiat
Immigrants from Eastern Europe
Cognitive Disability
Cognitive Disability Comparison
Inupiat
Immigrants from Eastern Europe
16.9%
COGNITIVE DISABILITY
96.5/ 100
METRIC RATING
116th/ 347
METRIC RANK
16.5%
COGNITIVE DISABILITY
99.9/ 100
METRIC RATING
38th/ 347
METRIC RANK
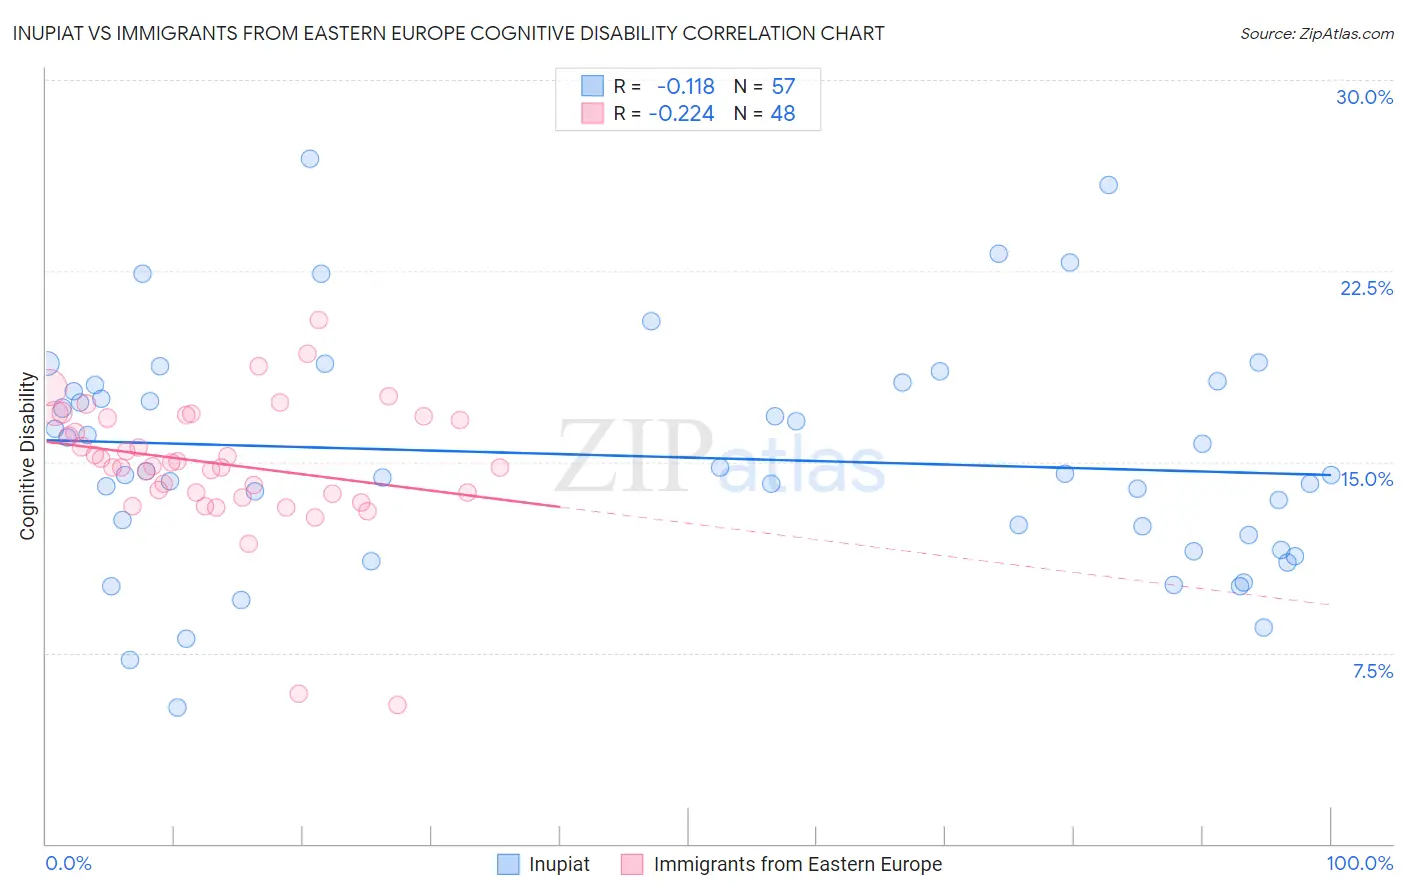
Inupiat vs Immigrants from Eastern Europe Cognitive Disability Correlation Chart
The statistical analysis conducted on geographies consisting of 96,337,062 people shows a poor negative correlation between the proportion of Inupiat and percentage of population with cognitive disability in the United States with a correlation coefficient (R) of -0.118 and weighted average of 16.9%. Similarly, the statistical analysis conducted on geographies consisting of 475,806,122 people shows a weak negative correlation between the proportion of Immigrants from Eastern Europe and percentage of population with cognitive disability in the United States with a correlation coefficient (R) of -0.224 and weighted average of 16.5%, a difference of 2.5%.
Cognitive Disability Correlation Summary
| Measurement | Inupiat | Immigrants from Eastern Europe |
| Minimum | 5.4% | 5.5% |
| Maximum | 26.9% | 20.6% |
| Range | 21.6% | 15.1% |
| Mean | 15.2% | 14.9% |
| Median | 14.5% | 14.9% |
| Interquartile 25% (IQ1) | 11.8% | 13.8% |
| Interquartile 75% (IQ3) | 18.1% | 16.8% |
| Interquartile Range (IQR) | 6.2% | 3.0% |
| Standard Deviation (Sample) | 4.5% | 2.7% |
| Standard Deviation (Population) | 4.5% | 2.6% |
Similar Demographics by Cognitive Disability
Demographics Similar to Inupiat by Cognitive Disability
In terms of cognitive disability, the demographic groups most similar to Inupiat are Immigrants from Japan (16.9%, a difference of 0.050%), Immigrants from Denmark (16.9%, a difference of 0.060%), Yup'ik (16.9%, a difference of 0.10%), Immigrants from Sri Lanka (16.8%, a difference of 0.15%), and Korean (16.8%, a difference of 0.15%).
| Demographics | Rating | Rank | Cognitive Disability |
| Albanians | 97.3 /100 | #109 | Exceptional 16.8% |
| Arapaho | 97.3 /100 | #110 | Exceptional 16.8% |
| Uruguayans | 97.2 /100 | #111 | Exceptional 16.8% |
| Indians (Asian) | 97.2 /100 | #112 | Exceptional 16.8% |
| Immigrants | Sri Lanka | 97.1 /100 | #113 | Exceptional 16.8% |
| Koreans | 97.1 /100 | #114 | Exceptional 16.8% |
| Yup'ik | 96.9 /100 | #115 | Exceptional 16.9% |
| Inupiat | 96.5 /100 | #116 | Exceptional 16.9% |
| Immigrants | Japan | 96.2 /100 | #117 | Exceptional 16.9% |
| Immigrants | Denmark | 96.2 /100 | #118 | Exceptional 16.9% |
| South Africans | 95.5 /100 | #119 | Exceptional 16.9% |
| Scottish | 95.0 /100 | #120 | Exceptional 16.9% |
| Immigrants | China | 94.9 /100 | #121 | Exceptional 16.9% |
| Immigrants | Western Europe | 94.8 /100 | #122 | Exceptional 16.9% |
| Portuguese | 94.7 /100 | #123 | Exceptional 16.9% |
Demographics Similar to Immigrants from Eastern Europe by Cognitive Disability
In terms of cognitive disability, the demographic groups most similar to Immigrants from Eastern Europe are Slovene (16.5%, a difference of 0.020%), Bolivian (16.5%, a difference of 0.070%), Immigrants from Belarus (16.5%, a difference of 0.090%), Cuban (16.5%, a difference of 0.090%), and Hungarian (16.5%, a difference of 0.10%).
| Demographics | Rating | Rank | Cognitive Disability |
| Immigrants | Romania | 99.9 /100 | #31 | Exceptional 16.4% |
| Immigrants | Israel | 99.9 /100 | #32 | Exceptional 16.4% |
| Italians | 99.9 /100 | #33 | Exceptional 16.4% |
| Russians | 99.9 /100 | #34 | Exceptional 16.4% |
| Slovaks | 99.9 /100 | #35 | Exceptional 16.4% |
| Greeks | 99.9 /100 | #36 | Exceptional 16.4% |
| Slovenes | 99.9 /100 | #37 | Exceptional 16.5% |
| Immigrants | Eastern Europe | 99.9 /100 | #38 | Exceptional 16.5% |
| Bolivians | 99.9 /100 | #39 | Exceptional 16.5% |
| Immigrants | Belarus | 99.9 /100 | #40 | Exceptional 16.5% |
| Cubans | 99.9 /100 | #41 | Exceptional 16.5% |
| Hungarians | 99.9 /100 | #42 | Exceptional 16.5% |
| Immigrants | Canada | 99.8 /100 | #43 | Exceptional 16.5% |
| Macedonians | 99.8 /100 | #44 | Exceptional 16.5% |
| Immigrants | Europe | 99.8 /100 | #45 | Exceptional 16.5% |