Indonesian vs Immigrants from Yemen Unemployment Among Youth under 25 years
COMPARE
Indonesian
Immigrants from Yemen
Unemployment Among Youth under 25 years
Unemployment Among Youth under 25 years Comparison
Indonesians
Immigrants from Yemen
10.6%
UNEMPLOYMENT AMONG YOUTH UNDER 25 YEARS
100.0/ 100
METRIC RATING
13th/ 347
METRIC RANK
15.6%
UNEMPLOYMENT AMONG YOUTH UNDER 25 YEARS
0.0/ 100
METRIC RATING
329th/ 347
METRIC RANK
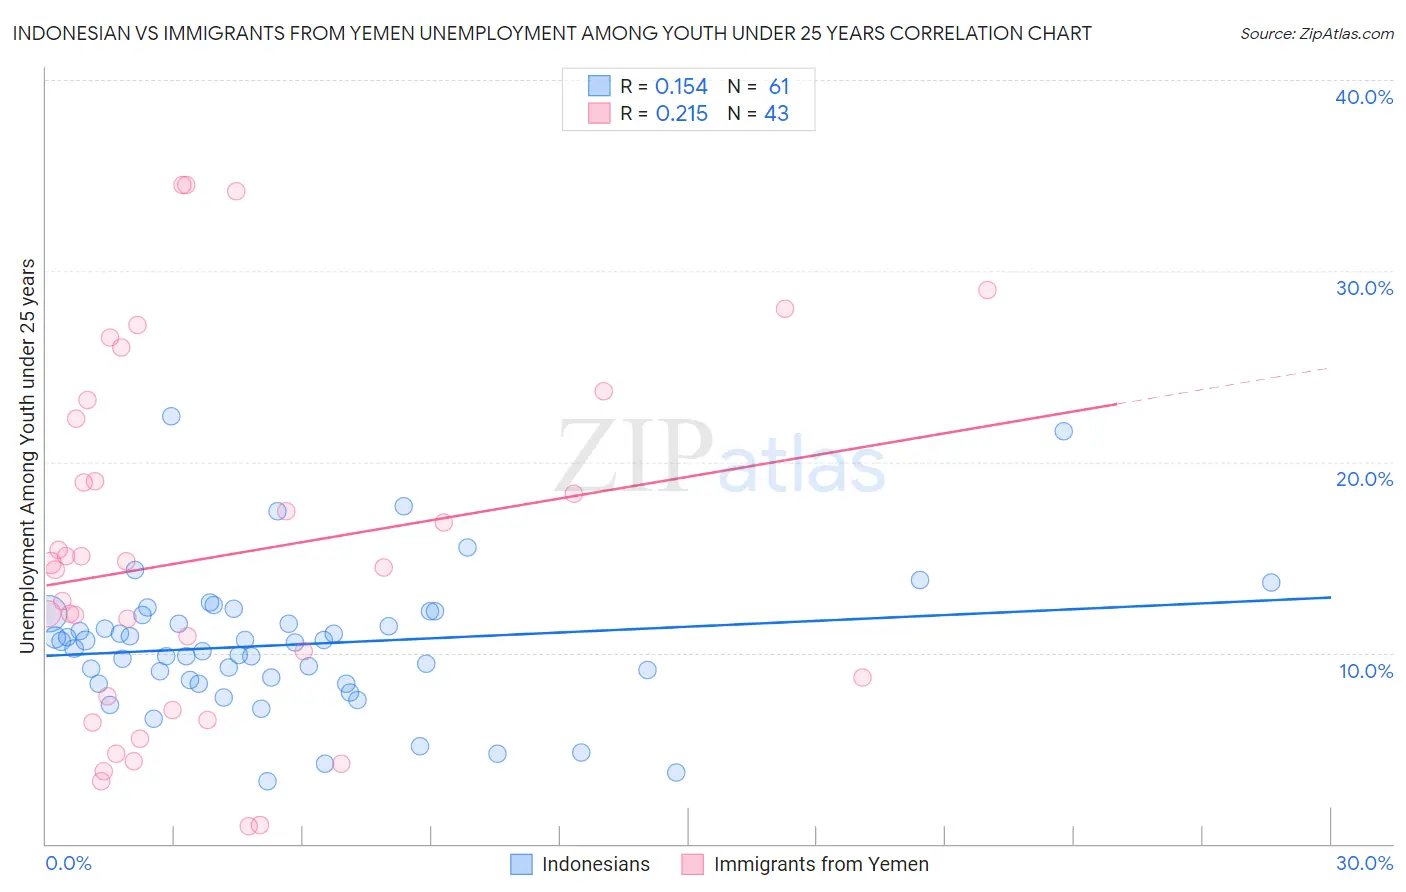
Indonesian vs Immigrants from Yemen Unemployment Among Youth under 25 years Correlation Chart
The statistical analysis conducted on geographies consisting of 162,194,941 people shows a poor positive correlation between the proportion of Indonesians and unemployment rate among youth under the age of 25 in the United States with a correlation coefficient (R) of 0.154 and weighted average of 10.6%. Similarly, the statistical analysis conducted on geographies consisting of 82,337,548 people shows a weak positive correlation between the proportion of Immigrants from Yemen and unemployment rate among youth under the age of 25 in the United States with a correlation coefficient (R) of 0.215 and weighted average of 15.6%, a difference of 47.5%.
Unemployment Among Youth under 25 years Correlation Summary
| Measurement | Indonesian | Immigrants from Yemen |
| Minimum | 3.3% | 0.90% |
| Maximum | 22.4% | 34.5% |
| Range | 19.1% | 33.6% |
| Mean | 10.4% | 15.1% |
| Median | 10.5% | 14.5% |
| Interquartile 25% (IQ1) | 8.5% | 7.0% |
| Interquartile 75% (IQ3) | 12.0% | 22.3% |
| Interquartile Range (IQR) | 3.5% | 15.3% |
| Standard Deviation (Sample) | 3.6% | 9.3% |
| Standard Deviation (Population) | 3.6% | 9.2% |
Similar Demographics by Unemployment Among Youth under 25 years
Demographics Similar to Indonesians by Unemployment Among Youth under 25 years
In terms of unemployment among youth under 25 years, the demographic groups most similar to Indonesians are Cuban (10.6%, a difference of 0.020%), Immigrants from Sudan (10.5%, a difference of 0.12%), Sudanese (10.6%, a difference of 0.13%), Venezuelan (10.6%, a difference of 0.14%), and Menominee (10.6%, a difference of 0.19%).
| Demographics | Rating | Rank | Unemployment Among Youth under 25 years |
| Danes | 100.0 /100 | #6 | Exceptional 10.3% |
| Swedes | 100.0 /100 | #7 | Exceptional 10.4% |
| Immigrants | Venezuela | 100.0 /100 | #8 | Exceptional 10.5% |
| Germans | 100.0 /100 | #9 | Exceptional 10.5% |
| Immigrants | Somalia | 100.0 /100 | #10 | Exceptional 10.5% |
| Scandinavians | 100.0 /100 | #11 | Exceptional 10.5% |
| Immigrants | Sudan | 100.0 /100 | #12 | Exceptional 10.5% |
| Indonesians | 100.0 /100 | #13 | Exceptional 10.6% |
| Cubans | 100.0 /100 | #14 | Exceptional 10.6% |
| Sudanese | 100.0 /100 | #15 | Exceptional 10.6% |
| Venezuelans | 100.0 /100 | #16 | Exceptional 10.6% |
| Menominee | 100.0 /100 | #17 | Exceptional 10.6% |
| Swiss | 100.0 /100 | #18 | Exceptional 10.6% |
| Immigrants | Burma/Myanmar | 100.0 /100 | #19 | Exceptional 10.6% |
| Dutch | 100.0 /100 | #20 | Exceptional 10.6% |
Demographics Similar to Immigrants from Yemen by Unemployment Among Youth under 25 years
In terms of unemployment among youth under 25 years, the demographic groups most similar to Immigrants from Yemen are Yakama (15.6%, a difference of 0.040%), Immigrants from Dominican Republic (15.6%, a difference of 0.13%), British West Indian (15.5%, a difference of 0.24%), Dominican (15.7%, a difference of 0.87%), and Immigrants from Grenada (15.8%, a difference of 1.5%).
| Demographics | Rating | Rank | Unemployment Among Youth under 25 years |
| Trinidadians and Tobagonians | 0.0 /100 | #322 | Tragic 14.6% |
| Immigrants | Trinidad and Tobago | 0.0 /100 | #323 | Tragic 14.6% |
| Immigrants | Jamaica | 0.0 /100 | #324 | Tragic 14.8% |
| Alaska Natives | 0.0 /100 | #325 | Tragic 14.9% |
| Immigrants | Barbados | 0.0 /100 | #326 | Tragic 15.2% |
| British West Indians | 0.0 /100 | #327 | Tragic 15.5% |
| Immigrants | Dominican Republic | 0.0 /100 | #328 | Tragic 15.6% |
| Immigrants | Yemen | 0.0 /100 | #329 | Tragic 15.6% |
| Yakama | 0.0 /100 | #330 | Tragic 15.6% |
| Dominicans | 0.0 /100 | #331 | Tragic 15.7% |
| Immigrants | Grenada | 0.0 /100 | #332 | Tragic 15.8% |
| Guyanese | 0.0 /100 | #333 | Tragic 15.9% |
| Immigrants | Guyana | 0.0 /100 | #334 | Tragic 15.9% |
| Immigrants | St. Vincent and the Grenadines | 0.0 /100 | #335 | Tragic 16.1% |
| Pima | 0.0 /100 | #336 | Tragic 16.2% |