Czechoslovakian vs Immigrants from El Salvador Hearing Disability
COMPARE
Czechoslovakian
Immigrants from El Salvador
Hearing Disability
Hearing Disability Comparison
Czechoslovakians
Immigrants from El Salvador
3.6%
HEARING DISABILITY
0.0/ 100
METRIC RATING
275th/ 347
METRIC RANK
2.6%
HEARING DISABILITY
99.7/ 100
METRIC RATING
25th/ 347
METRIC RANK
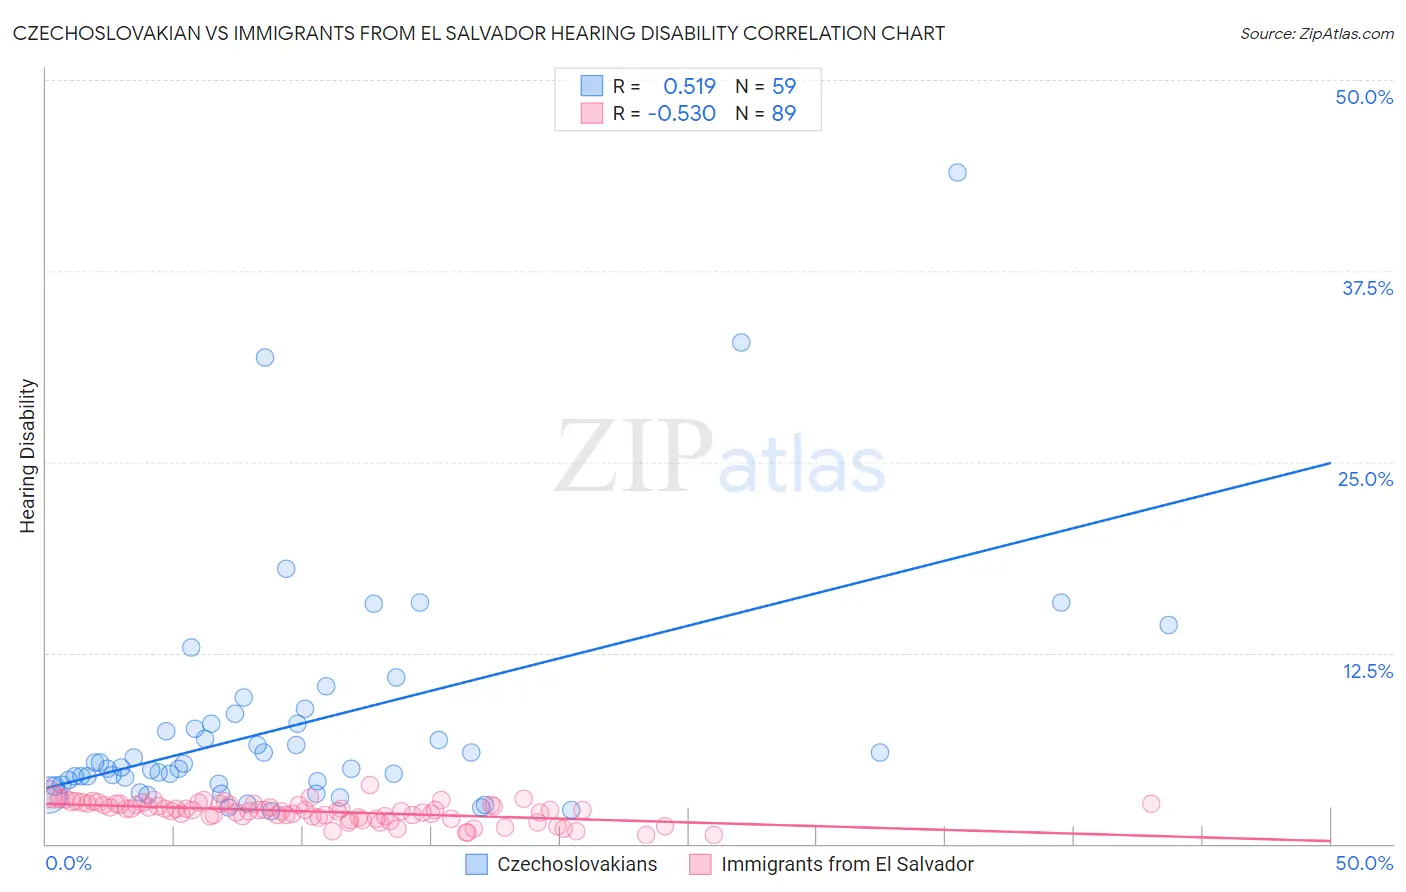
Czechoslovakian vs Immigrants from El Salvador Hearing Disability Correlation Chart
The statistical analysis conducted on geographies consisting of 368,630,521 people shows a substantial positive correlation between the proportion of Czechoslovakians and percentage of population with hearing disability in the United States with a correlation coefficient (R) of 0.519 and weighted average of 3.6%. Similarly, the statistical analysis conducted on geographies consisting of 357,678,057 people shows a substantial negative correlation between the proportion of Immigrants from El Salvador and percentage of population with hearing disability in the United States with a correlation coefficient (R) of -0.530 and weighted average of 2.6%, a difference of 37.6%.
Hearing Disability Correlation Summary
| Measurement | Czechoslovakian | Immigrants from El Salvador |
| Minimum | 2.1% | 0.55% |
| Maximum | 44.0% | 3.9% |
| Range | 41.8% | 3.3% |
| Mean | 7.8% | 2.1% |
| Median | 5.0% | 2.2% |
| Interquartile 25% (IQ1) | 3.9% | 1.8% |
| Interquartile 75% (IQ3) | 7.9% | 2.6% |
| Interquartile Range (IQR) | 4.0% | 0.86% |
| Standard Deviation (Sample) | 7.7% | 0.67% |
| Standard Deviation (Population) | 7.6% | 0.66% |
Similar Demographics by Hearing Disability
Demographics Similar to Czechoslovakians by Hearing Disability
In terms of hearing disability, the demographic groups most similar to Czechoslovakians are Danish (3.6%, a difference of 0.12%), Swiss (3.5%, a difference of 0.20%), Puerto Rican (3.5%, a difference of 0.53%), Fijian (3.5%, a difference of 0.60%), and Nonimmigrants (3.6%, a difference of 0.82%).
| Demographics | Rating | Rank | Hearing Disability |
| Spaniards | 0.1 /100 | #268 | Tragic 3.5% |
| Ute | 0.1 /100 | #269 | Tragic 3.5% |
| Europeans | 0.1 /100 | #270 | Tragic 3.5% |
| Czechs | 0.1 /100 | #271 | Tragic 3.5% |
| Fijians | 0.0 /100 | #272 | Tragic 3.5% |
| Puerto Ricans | 0.0 /100 | #273 | Tragic 3.5% |
| Swiss | 0.0 /100 | #274 | Tragic 3.5% |
| Czechoslovakians | 0.0 /100 | #275 | Tragic 3.6% |
| Danes | 0.0 /100 | #276 | Tragic 3.6% |
| Immigrants | Nonimmigrants | 0.0 /100 | #277 | Tragic 3.6% |
| Basques | 0.0 /100 | #278 | Tragic 3.6% |
| Slovaks | 0.0 /100 | #279 | Tragic 3.6% |
| French American Indians | 0.0 /100 | #280 | Tragic 3.6% |
| Scandinavians | 0.0 /100 | #281 | Tragic 3.6% |
| Swedes | 0.0 /100 | #282 | Tragic 3.6% |
Demographics Similar to Immigrants from El Salvador by Hearing Disability
In terms of hearing disability, the demographic groups most similar to Immigrants from El Salvador are Immigrants from Senegal (2.6%, a difference of 0.010%), Immigrants from South Central Asia (2.6%, a difference of 0.050%), Immigrants from Ghana (2.6%, a difference of 0.40%), Immigrants from Haiti (2.6%, a difference of 0.42%), and Bolivian (2.6%, a difference of 0.45%).
| Demographics | Rating | Rank | Hearing Disability |
| Dominicans | 99.8 /100 | #18 | Exceptional 2.5% |
| Thais | 99.8 /100 | #19 | Exceptional 2.5% |
| Immigrants | Bolivia | 99.8 /100 | #20 | Exceptional 2.5% |
| Ghanaians | 99.8 /100 | #21 | Exceptional 2.5% |
| Immigrants | Sierra Leone | 99.8 /100 | #22 | Exceptional 2.6% |
| Immigrants | Nigeria | 99.8 /100 | #23 | Exceptional 2.6% |
| Immigrants | Ghana | 99.8 /100 | #24 | Exceptional 2.6% |
| Immigrants | El Salvador | 99.7 /100 | #25 | Exceptional 2.6% |
| Immigrants | Senegal | 99.7 /100 | #26 | Exceptional 2.6% |
| Immigrants | South Central Asia | 99.7 /100 | #27 | Exceptional 2.6% |
| Immigrants | Haiti | 99.7 /100 | #28 | Exceptional 2.6% |
| Bolivians | 99.7 /100 | #29 | Exceptional 2.6% |
| Immigrants | Caribbean | 99.7 /100 | #30 | Exceptional 2.6% |
| Immigrants | Cameroon | 99.7 /100 | #31 | Exceptional 2.6% |
| Immigrants | Venezuela | 99.7 /100 | #32 | Exceptional 2.6% |