Yugoslavian vs Fijian Cognitive Disability
COMPARE
Yugoslavian
Fijian
Cognitive Disability
Cognitive Disability Comparison
Yugoslavians
Fijians
17.2%
COGNITIVE DISABILITY
71.6/ 100
METRIC RATING
162nd/ 347
METRIC RANK
17.7%
COGNITIVE DISABILITY
3.4/ 100
METRIC RATING
224th/ 347
METRIC RANK
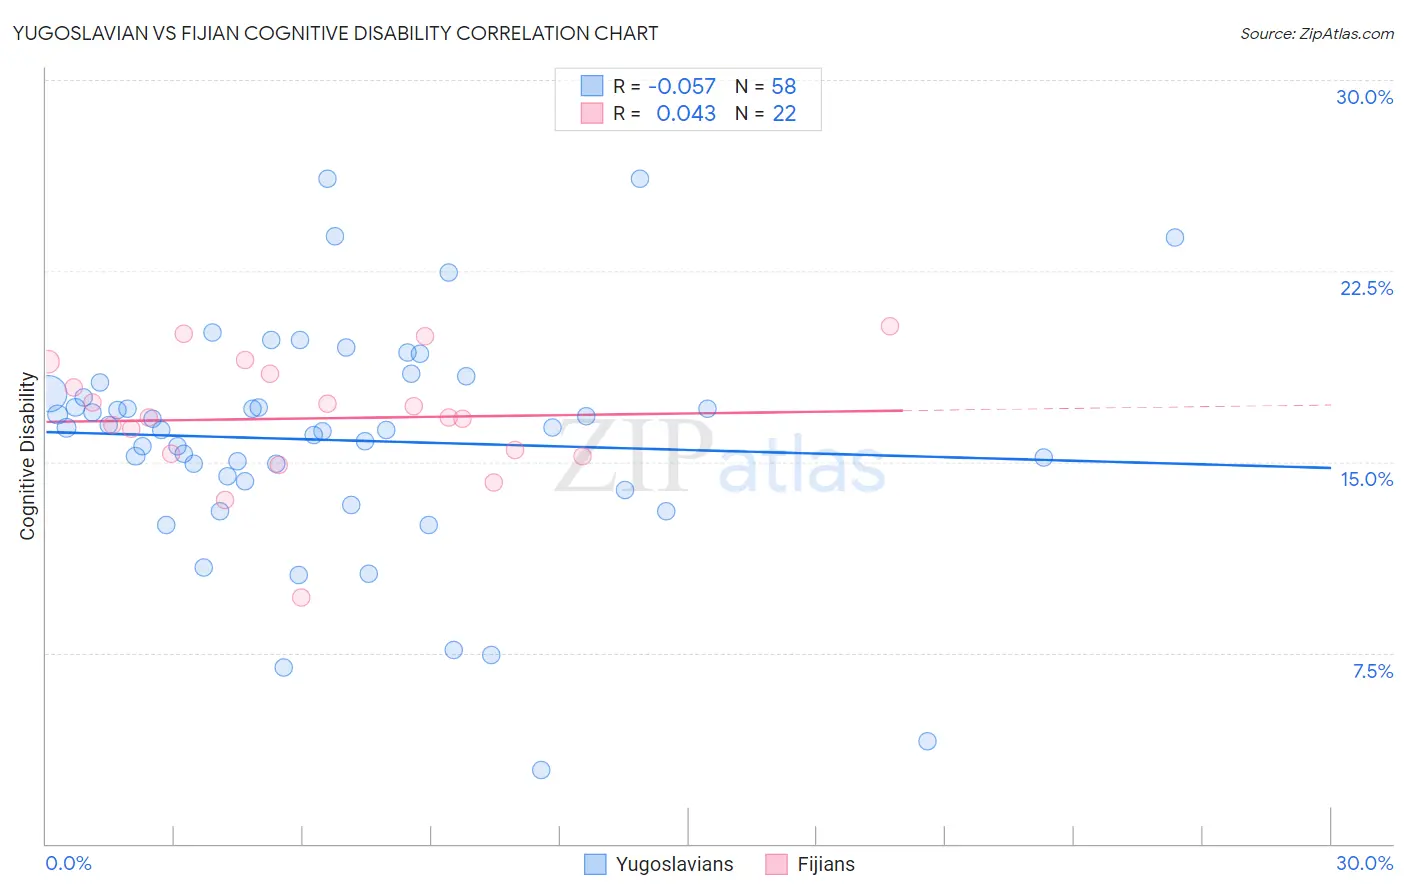
Yugoslavian vs Fijian Cognitive Disability Correlation Chart
The statistical analysis conducted on geographies consisting of 285,698,583 people shows a slight negative correlation between the proportion of Yugoslavians and percentage of population with cognitive disability in the United States with a correlation coefficient (R) of -0.057 and weighted average of 17.2%. Similarly, the statistical analysis conducted on geographies consisting of 55,934,490 people shows no correlation between the proportion of Fijians and percentage of population with cognitive disability in the United States with a correlation coefficient (R) of 0.043 and weighted average of 17.7%, a difference of 3.0%.
Cognitive Disability Correlation Summary
| Measurement | Yugoslavian | Fijian |
| Minimum | 2.9% | 9.7% |
| Maximum | 26.1% | 20.3% |
| Range | 23.2% | 10.6% |
| Mean | 15.9% | 16.7% |
| Median | 16.3% | 16.7% |
| Interquartile 25% (IQ1) | 14.3% | 15.3% |
| Interquartile 75% (IQ3) | 17.7% | 18.4% |
| Interquartile Range (IQR) | 3.4% | 3.1% |
| Standard Deviation (Sample) | 4.5% | 2.4% |
| Standard Deviation (Population) | 4.5% | 2.4% |
Similar Demographics by Cognitive Disability
Demographics Similar to Yugoslavians by Cognitive Disability
In terms of cognitive disability, the demographic groups most similar to Yugoslavians are Immigrants from Switzerland (17.2%, a difference of 0.0%), American (17.2%, a difference of 0.020%), Australian (17.2%, a difference of 0.030%), Armenian (17.2%, a difference of 0.050%), and Immigrants from Latvia (17.2%, a difference of 0.060%).
| Demographics | Rating | Rank | Cognitive Disability |
| Brazilians | 78.9 /100 | #155 | Good 17.1% |
| Sri Lankans | 78.9 /100 | #156 | Good 17.1% |
| Immigrants | Australia | 76.0 /100 | #157 | Good 17.1% |
| Celtics | 74.1 /100 | #158 | Good 17.1% |
| Immigrants | Latvia | 73.2 /100 | #159 | Good 17.2% |
| Australians | 72.4 /100 | #160 | Good 17.2% |
| Americans | 72.2 /100 | #161 | Good 17.2% |
| Yugoslavians | 71.6 /100 | #162 | Good 17.2% |
| Immigrants | Switzerland | 71.5 /100 | #163 | Good 17.2% |
| Armenians | 70.1 /100 | #164 | Good 17.2% |
| Immigrants | Albania | 64.9 /100 | #165 | Good 17.2% |
| Immigrants | Ecuador | 64.4 /100 | #166 | Good 17.2% |
| Immigrants | Syria | 63.5 /100 | #167 | Good 17.2% |
| Immigrants | Immigrants | 62.5 /100 | #168 | Good 17.2% |
| Immigrants | Portugal | 61.8 /100 | #169 | Good 17.2% |
Demographics Similar to Fijians by Cognitive Disability
In terms of cognitive disability, the demographic groups most similar to Fijians are Vietnamese (17.7%, a difference of 0.010%), Marshallese (17.7%, a difference of 0.17%), Alsatian (17.7%, a difference of 0.19%), Central American (17.7%, a difference of 0.20%), and Immigrants from St. Vincent and the Grenadines (17.7%, a difference of 0.20%).
| Demographics | Rating | Rank | Cognitive Disability |
| Salvadorans | 6.7 /100 | #217 | Tragic 17.6% |
| Icelanders | 6.4 /100 | #218 | Tragic 17.6% |
| Immigrants | Sierra Leone | 6.3 /100 | #219 | Tragic 17.6% |
| Zimbabweans | 6.1 /100 | #220 | Tragic 17.6% |
| Moroccans | 5.9 /100 | #221 | Tragic 17.6% |
| Central Americans | 4.5 /100 | #222 | Tragic 17.7% |
| Alsatians | 4.5 /100 | #223 | Tragic 17.7% |
| Fijians | 3.4 /100 | #224 | Tragic 17.7% |
| Vietnamese | 3.4 /100 | #225 | Tragic 17.7% |
| Marshallese | 2.7 /100 | #226 | Tragic 17.7% |
| Immigrants | St. Vincent and the Grenadines | 2.6 /100 | #227 | Tragic 17.7% |
| Immigrants | Central America | 2.3 /100 | #228 | Tragic 17.7% |
| Immigrants | Guatemala | 2.2 /100 | #229 | Tragic 17.7% |
| Mongolians | 2.2 /100 | #230 | Tragic 17.7% |
| Guatemalans | 2.1 /100 | #231 | Tragic 17.8% |