Palestinian vs Fijian Cognitive Disability
COMPARE
Palestinian
Fijian
Cognitive Disability
Cognitive Disability Comparison
Palestinians
Fijians
16.8%
COGNITIVE DISABILITY
98.0/ 100
METRIC RATING
104th/ 347
METRIC RANK
17.7%
COGNITIVE DISABILITY
3.4/ 100
METRIC RATING
224th/ 347
METRIC RANK
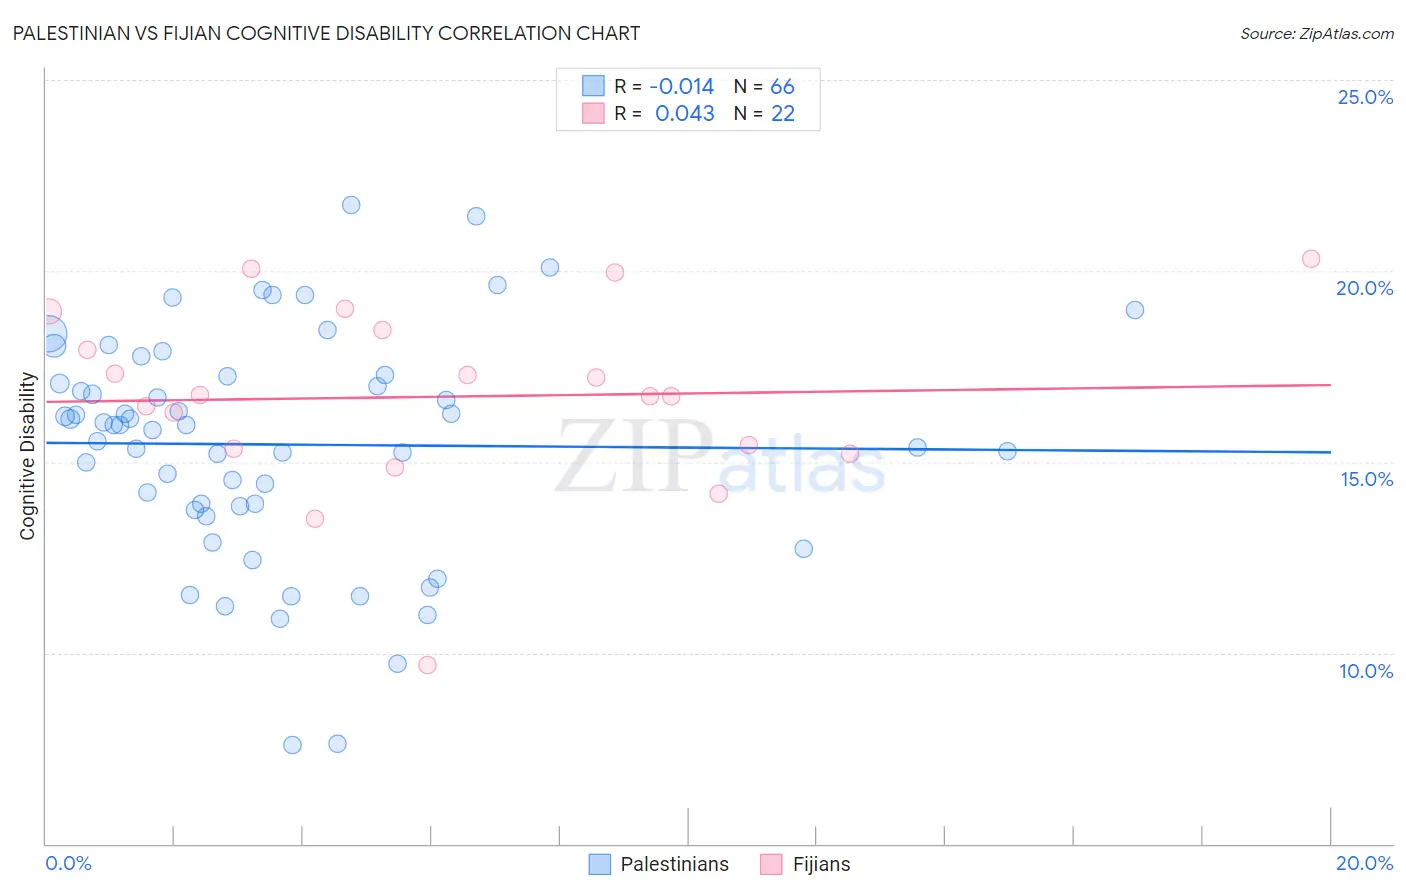
Palestinian vs Fijian Cognitive Disability Correlation Chart
The statistical analysis conducted on geographies consisting of 216,464,983 people shows no correlation between the proportion of Palestinians and percentage of population with cognitive disability in the United States with a correlation coefficient (R) of -0.014 and weighted average of 16.8%. Similarly, the statistical analysis conducted on geographies consisting of 55,934,490 people shows no correlation between the proportion of Fijians and percentage of population with cognitive disability in the United States with a correlation coefficient (R) of 0.043 and weighted average of 17.7%, a difference of 5.3%.
Cognitive Disability Correlation Summary
| Measurement | Palestinian | Fijian |
| Minimum | 7.6% | 9.7% |
| Maximum | 21.7% | 20.3% |
| Range | 14.1% | 10.6% |
| Mean | 15.5% | 16.7% |
| Median | 16.0% | 16.7% |
| Interquartile 25% (IQ1) | 13.8% | 15.3% |
| Interquartile 75% (IQ3) | 17.3% | 18.4% |
| Interquartile Range (IQR) | 3.4% | 3.1% |
| Standard Deviation (Sample) | 3.0% | 2.4% |
| Standard Deviation (Population) | 3.0% | 2.4% |
Similar Demographics by Cognitive Disability
Demographics Similar to Palestinians by Cognitive Disability
In terms of cognitive disability, the demographic groups most similar to Palestinians are Paraguayan (16.8%, a difference of 0.0%), Immigrants from Eastern Asia (16.8%, a difference of 0.010%), Irish (16.8%, a difference of 0.050%), Northern European (16.8%, a difference of 0.050%), and Immigrants from Asia (16.8%, a difference of 0.070%).
| Demographics | Rating | Rank | Cognitive Disability |
| Dutch | 98.5 /100 | #97 | Exceptional 16.8% |
| Immigrants | Lebanon | 98.4 /100 | #98 | Exceptional 16.8% |
| Jordanians | 98.2 /100 | #99 | Exceptional 16.8% |
| Immigrants | Russia | 98.2 /100 | #100 | Exceptional 16.8% |
| Immigrants | Asia | 98.1 /100 | #101 | Exceptional 16.8% |
| Irish | 98.1 /100 | #102 | Exceptional 16.8% |
| Paraguayans | 98.0 /100 | #103 | Exceptional 16.8% |
| Palestinians | 98.0 /100 | #104 | Exceptional 16.8% |
| Immigrants | Eastern Asia | 97.9 /100 | #105 | Exceptional 16.8% |
| Northern Europeans | 97.8 /100 | #106 | Exceptional 16.8% |
| Immigrants | Nicaragua | 97.8 /100 | #107 | Exceptional 16.8% |
| Canadians | 97.5 /100 | #108 | Exceptional 16.8% |
| Albanians | 97.3 /100 | #109 | Exceptional 16.8% |
| Arapaho | 97.3 /100 | #110 | Exceptional 16.8% |
| Uruguayans | 97.2 /100 | #111 | Exceptional 16.8% |
Demographics Similar to Fijians by Cognitive Disability
In terms of cognitive disability, the demographic groups most similar to Fijians are Vietnamese (17.7%, a difference of 0.010%), Marshallese (17.7%, a difference of 0.17%), Alsatian (17.7%, a difference of 0.19%), Central American (17.7%, a difference of 0.20%), and Immigrants from St. Vincent and the Grenadines (17.7%, a difference of 0.20%).
| Demographics | Rating | Rank | Cognitive Disability |
| Salvadorans | 6.7 /100 | #217 | Tragic 17.6% |
| Icelanders | 6.4 /100 | #218 | Tragic 17.6% |
| Immigrants | Sierra Leone | 6.3 /100 | #219 | Tragic 17.6% |
| Zimbabweans | 6.1 /100 | #220 | Tragic 17.6% |
| Moroccans | 5.9 /100 | #221 | Tragic 17.6% |
| Central Americans | 4.5 /100 | #222 | Tragic 17.7% |
| Alsatians | 4.5 /100 | #223 | Tragic 17.7% |
| Fijians | 3.4 /100 | #224 | Tragic 17.7% |
| Vietnamese | 3.4 /100 | #225 | Tragic 17.7% |
| Marshallese | 2.7 /100 | #226 | Tragic 17.7% |
| Immigrants | St. Vincent and the Grenadines | 2.6 /100 | #227 | Tragic 17.7% |
| Immigrants | Central America | 2.3 /100 | #228 | Tragic 17.7% |
| Immigrants | Guatemala | 2.2 /100 | #229 | Tragic 17.7% |
| Mongolians | 2.2 /100 | #230 | Tragic 17.7% |
| Guatemalans | 2.1 /100 | #231 | Tragic 17.8% |