Immigrants from South Central Asia vs Bulgarian Cognitive Disability
COMPARE
Immigrants from South Central Asia
Bulgarian
Cognitive Disability
Cognitive Disability Comparison
Immigrants from South Central Asia
Bulgarians
16.4%
COGNITIVE DISABILITY
99.9/ 100
METRIC RATING
22nd/ 347
METRIC RANK
16.3%
COGNITIVE DISABILITY
100.0/ 100
METRIC RATING
20th/ 347
METRIC RANK
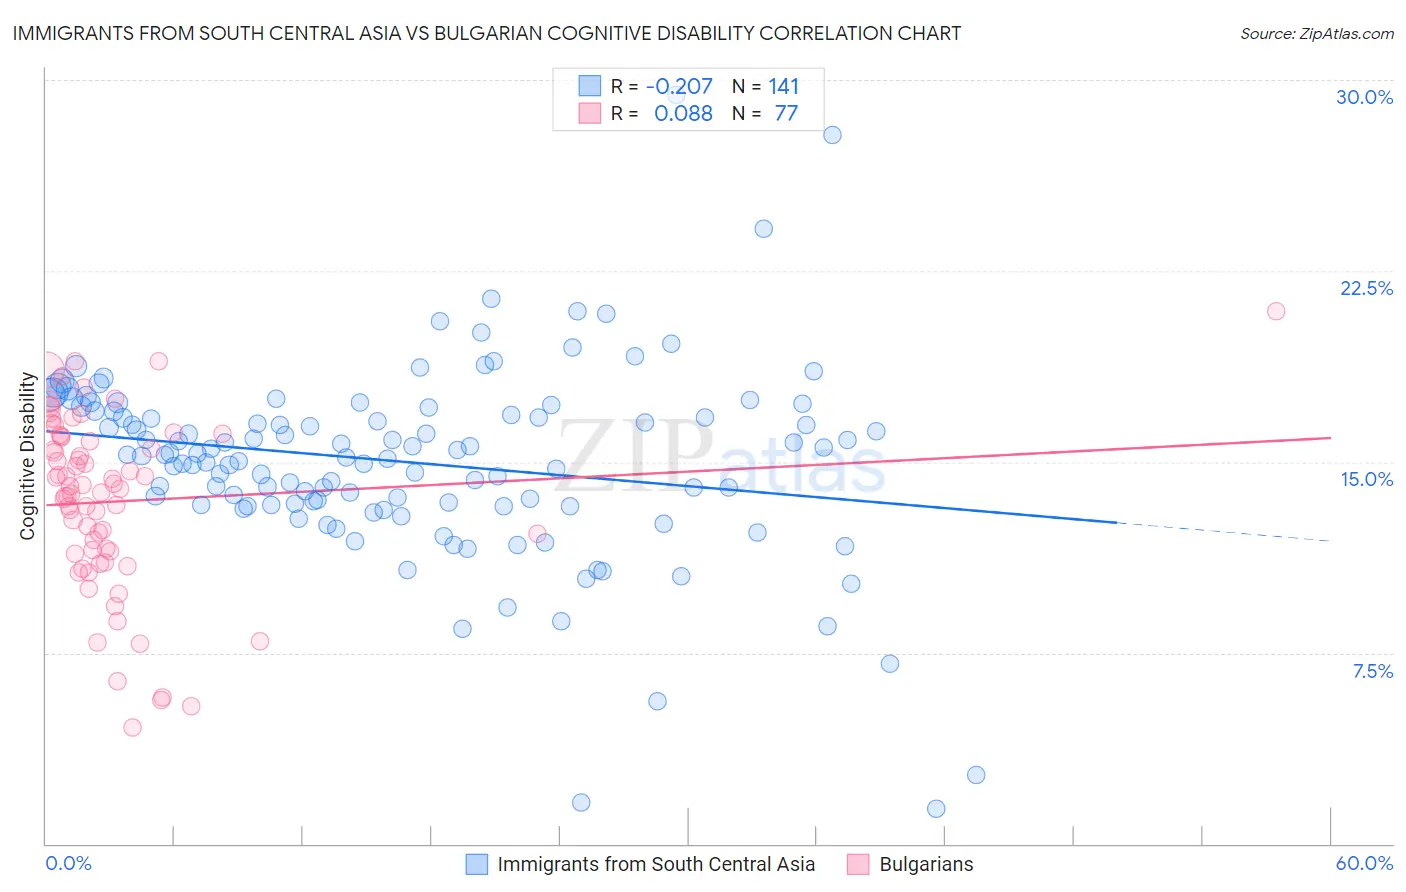
Immigrants from South Central Asia vs Bulgarian Cognitive Disability Correlation Chart
The statistical analysis conducted on geographies consisting of 473,055,858 people shows a weak negative correlation between the proportion of Immigrants from South Central Asia and percentage of population with cognitive disability in the United States with a correlation coefficient (R) of -0.207 and weighted average of 16.4%. Similarly, the statistical analysis conducted on geographies consisting of 205,630,797 people shows a slight positive correlation between the proportion of Bulgarians and percentage of population with cognitive disability in the United States with a correlation coefficient (R) of 0.088 and weighted average of 16.3%, a difference of 0.17%.
Cognitive Disability Correlation Summary
| Measurement | Immigrants from South Central Asia | Bulgarian |
| Minimum | 1.4% | 4.6% |
| Maximum | 29.4% | 20.9% |
| Range | 28.0% | 16.4% |
| Mean | 15.0% | 13.4% |
| Median | 15.3% | 14.0% |
| Interquartile 25% (IQ1) | 13.3% | 11.4% |
| Interquartile 75% (IQ3) | 17.0% | 16.0% |
| Interquartile Range (IQR) | 3.7% | 4.6% |
| Standard Deviation (Sample) | 3.8% | 3.4% |
| Standard Deviation (Population) | 3.8% | 3.4% |
Demographics Similar to Immigrants from South Central Asia and Bulgarians by Cognitive Disability
In terms of cognitive disability, the demographic groups most similar to Immigrants from South Central Asia are Croatian (16.4%, a difference of 0.030%), Immigrants from Argentina (16.4%, a difference of 0.060%), Luxembourger (16.4%, a difference of 0.10%), Immigrants from Cuba (16.3%, a difference of 0.13%), and Immigrants from Croatia (16.4%, a difference of 0.13%). Similarly, the demographic groups most similar to Bulgarians are Immigrants from Bolivia (16.3%, a difference of 0.010%), Immigrants from Northern Europe (16.3%, a difference of 0.020%), Immigrants from Cuba (16.3%, a difference of 0.040%), Immigrants from North Macedonia (16.3%, a difference of 0.080%), and Eastern European (16.3%, a difference of 0.10%).
| Demographics | Rating | Rank | Cognitive Disability |
| Immigrants | Czechoslovakia | 100.0 /100 | #11 | Exceptional 16.2% |
| Maltese | 100.0 /100 | #12 | Exceptional 16.2% |
| Lithuanians | 100.0 /100 | #13 | Exceptional 16.3% |
| Immigrants | Austria | 100.0 /100 | #14 | Exceptional 16.3% |
| Immigrants | Greece | 100.0 /100 | #15 | Exceptional 16.3% |
| Eastern Europeans | 100.0 /100 | #16 | Exceptional 16.3% |
| Immigrants | North Macedonia | 100.0 /100 | #17 | Exceptional 16.3% |
| Immigrants | Northern Europe | 100.0 /100 | #18 | Exceptional 16.3% |
| Immigrants | Bolivia | 100.0 /100 | #19 | Exceptional 16.3% |
| Bulgarians | 100.0 /100 | #20 | Exceptional 16.3% |
| Immigrants | Cuba | 100.0 /100 | #21 | Exceptional 16.3% |
| Immigrants | South Central Asia | 99.9 /100 | #22 | Exceptional 16.4% |
| Croatians | 99.9 /100 | #23 | Exceptional 16.4% |
| Immigrants | Argentina | 99.9 /100 | #24 | Exceptional 16.4% |
| Luxembourgers | 99.9 /100 | #25 | Exceptional 16.4% |
| Immigrants | Croatia | 99.9 /100 | #26 | Exceptional 16.4% |
| Immigrants | Pakistan | 99.9 /100 | #27 | Exceptional 16.4% |
| Poles | 99.9 /100 | #28 | Exceptional 16.4% |
| Filipinos | 99.9 /100 | #29 | Exceptional 16.4% |
| Czechs | 99.9 /100 | #30 | Exceptional 16.4% |
| Immigrants | Romania | 99.9 /100 | #31 | Exceptional 16.4% |