English vs Bulgarian Cognitive Disability
COMPARE
English
Bulgarian
Cognitive Disability
Cognitive Disability Comparison
English
Bulgarians
16.8%
COGNITIVE DISABILITY
98.6/ 100
METRIC RATING
95th/ 347
METRIC RANK
16.3%
COGNITIVE DISABILITY
100.0/ 100
METRIC RATING
20th/ 347
METRIC RANK
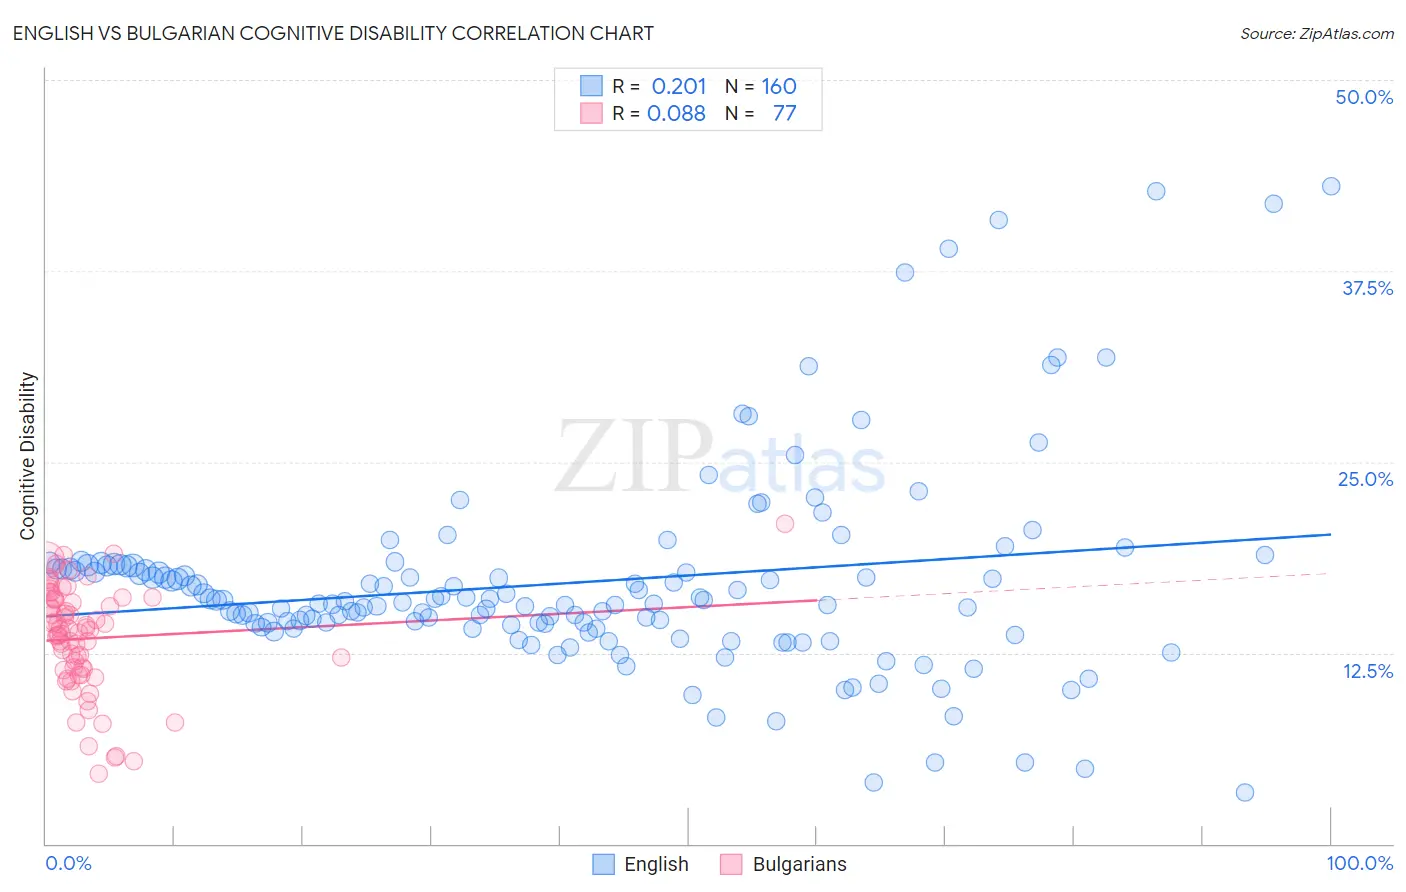
English vs Bulgarian Cognitive Disability Correlation Chart
The statistical analysis conducted on geographies consisting of 579,706,008 people shows a weak positive correlation between the proportion of English and percentage of population with cognitive disability in the United States with a correlation coefficient (R) of 0.201 and weighted average of 16.8%. Similarly, the statistical analysis conducted on geographies consisting of 205,630,797 people shows a slight positive correlation between the proportion of Bulgarians and percentage of population with cognitive disability in the United States with a correlation coefficient (R) of 0.088 and weighted average of 16.3%, a difference of 2.6%.
Cognitive Disability Correlation Summary
| Measurement | English | Bulgarian |
| Minimum | 3.4% | 4.6% |
| Maximum | 43.0% | 20.9% |
| Range | 39.7% | 16.4% |
| Mean | 17.1% | 13.4% |
| Median | 15.8% | 14.0% |
| Interquartile 25% (IQ1) | 14.3% | 11.4% |
| Interquartile 75% (IQ3) | 18.1% | 16.0% |
| Interquartile Range (IQR) | 3.8% | 4.6% |
| Standard Deviation (Sample) | 6.6% | 3.4% |
| Standard Deviation (Population) | 6.6% | 3.4% |
Similar Demographics by Cognitive Disability
Demographics Similar to English by Cognitive Disability
In terms of cognitive disability, the demographic groups most similar to English are Finnish (16.8%, a difference of 0.020%), Dutch (16.8%, a difference of 0.040%), Asian (16.7%, a difference of 0.060%), Immigrants from Lebanon (16.8%, a difference of 0.060%), and Immigrants from South America (16.7%, a difference of 0.11%).
| Demographics | Rating | Rank | Cognitive Disability |
| Immigrants | Philippines | 99.0 /100 | #88 | Exceptional 16.7% |
| Immigrants | Egypt | 98.8 /100 | #89 | Exceptional 16.7% |
| South Americans | 98.8 /100 | #90 | Exceptional 16.7% |
| Danes | 98.8 /100 | #91 | Exceptional 16.7% |
| Immigrants | South America | 98.8 /100 | #92 | Exceptional 16.7% |
| Immigrants | Southern Europe | 98.7 /100 | #93 | Exceptional 16.7% |
| Asians | 98.7 /100 | #94 | Exceptional 16.7% |
| English | 98.6 /100 | #95 | Exceptional 16.8% |
| Finns | 98.5 /100 | #96 | Exceptional 16.8% |
| Dutch | 98.5 /100 | #97 | Exceptional 16.8% |
| Immigrants | Lebanon | 98.4 /100 | #98 | Exceptional 16.8% |
| Jordanians | 98.2 /100 | #99 | Exceptional 16.8% |
| Immigrants | Russia | 98.2 /100 | #100 | Exceptional 16.8% |
| Immigrants | Asia | 98.1 /100 | #101 | Exceptional 16.8% |
| Irish | 98.1 /100 | #102 | Exceptional 16.8% |
Demographics Similar to Bulgarians by Cognitive Disability
In terms of cognitive disability, the demographic groups most similar to Bulgarians are Immigrants from Bolivia (16.3%, a difference of 0.010%), Immigrants from Northern Europe (16.3%, a difference of 0.020%), Immigrants from Cuba (16.3%, a difference of 0.040%), Immigrants from North Macedonia (16.3%, a difference of 0.080%), and Eastern European (16.3%, a difference of 0.10%).
| Demographics | Rating | Rank | Cognitive Disability |
| Lithuanians | 100.0 /100 | #13 | Exceptional 16.3% |
| Immigrants | Austria | 100.0 /100 | #14 | Exceptional 16.3% |
| Immigrants | Greece | 100.0 /100 | #15 | Exceptional 16.3% |
| Eastern Europeans | 100.0 /100 | #16 | Exceptional 16.3% |
| Immigrants | North Macedonia | 100.0 /100 | #17 | Exceptional 16.3% |
| Immigrants | Northern Europe | 100.0 /100 | #18 | Exceptional 16.3% |
| Immigrants | Bolivia | 100.0 /100 | #19 | Exceptional 16.3% |
| Bulgarians | 100.0 /100 | #20 | Exceptional 16.3% |
| Immigrants | Cuba | 100.0 /100 | #21 | Exceptional 16.3% |
| Immigrants | South Central Asia | 99.9 /100 | #22 | Exceptional 16.4% |
| Croatians | 99.9 /100 | #23 | Exceptional 16.4% |
| Immigrants | Argentina | 99.9 /100 | #24 | Exceptional 16.4% |
| Luxembourgers | 99.9 /100 | #25 | Exceptional 16.4% |
| Immigrants | Croatia | 99.9 /100 | #26 | Exceptional 16.4% |
| Immigrants | Pakistan | 99.9 /100 | #27 | Exceptional 16.4% |