Immigrants from Bahamas vs Asian Male Disability
COMPARE
Immigrants from Bahamas
Asian
Male Disability
Male Disability Comparison
Immigrants from Bahamas
Asians
11.7%
MALE DISABILITY
3.2/ 100
METRIC RATING
223rd/ 347
METRIC RANK
10.0%
MALE DISABILITY
100.0/ 100
METRIC RATING
20th/ 347
METRIC RANK
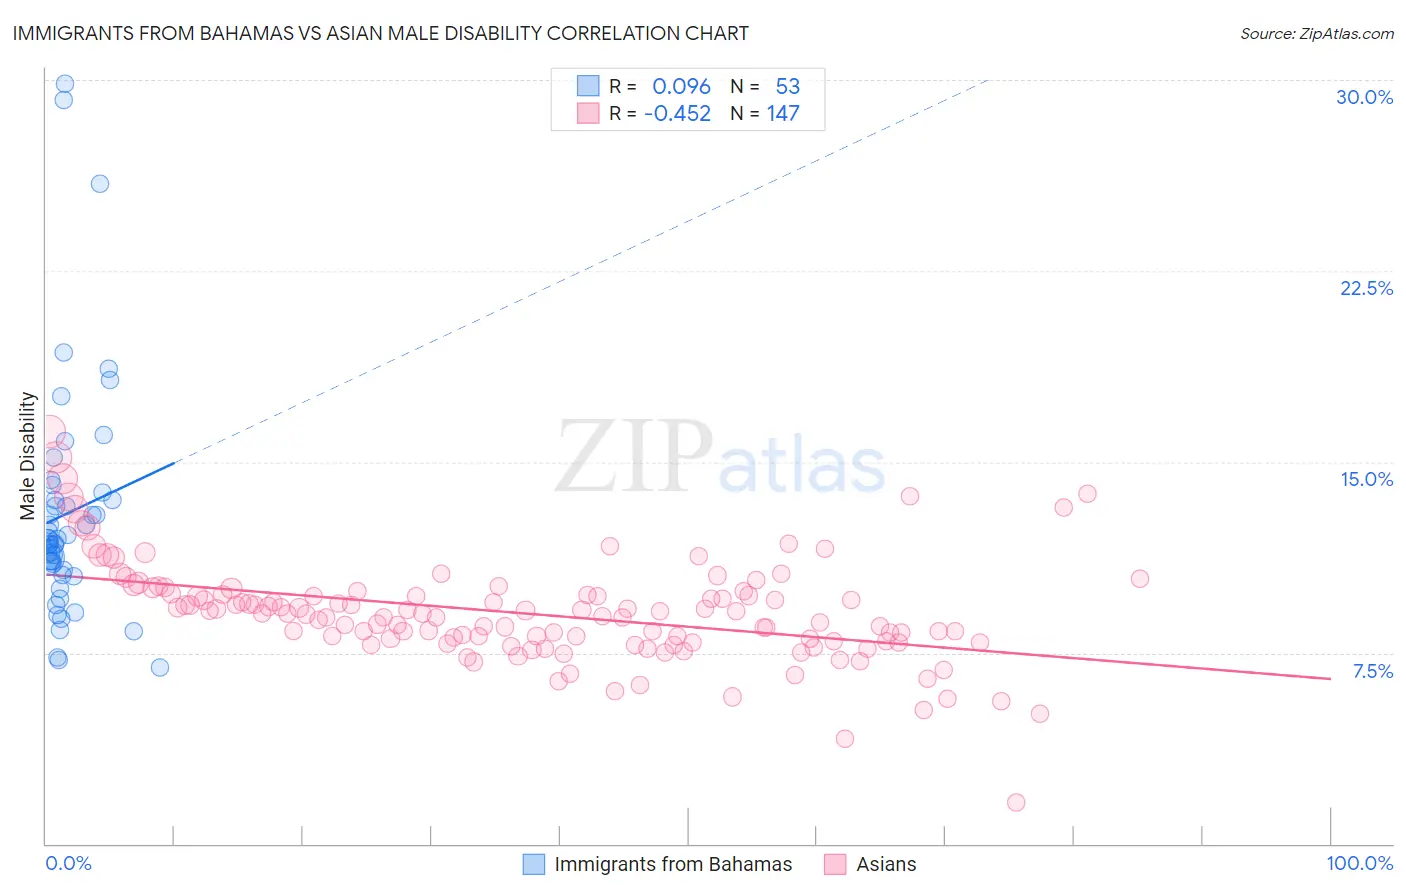
Immigrants from Bahamas vs Asian Male Disability Correlation Chart
The statistical analysis conducted on geographies consisting of 104,654,023 people shows a slight positive correlation between the proportion of Immigrants from Bahamas and percentage of males with a disability in the United States with a correlation coefficient (R) of 0.096 and weighted average of 11.7%. Similarly, the statistical analysis conducted on geographies consisting of 550,680,295 people shows a moderate negative correlation between the proportion of Asians and percentage of males with a disability in the United States with a correlation coefficient (R) of -0.452 and weighted average of 10.0%, a difference of 17.9%.
Male Disability Correlation Summary
| Measurement | Immigrants from Bahamas | Asian |
| Minimum | 6.9% | 1.6% |
| Maximum | 29.9% | 16.2% |
| Range | 23.0% | 14.6% |
| Mean | 13.0% | 9.0% |
| Median | 11.9% | 9.0% |
| Interquartile 25% (IQ1) | 10.7% | 7.9% |
| Interquartile 75% (IQ3) | 13.6% | 9.8% |
| Interquartile Range (IQR) | 3.0% | 1.8% |
| Standard Deviation (Sample) | 4.7% | 2.0% |
| Standard Deviation (Population) | 4.6% | 2.0% |
Similar Demographics by Male Disability
Demographics Similar to Immigrants from Bahamas by Male Disability
In terms of male disability, the demographic groups most similar to Immigrants from Bahamas are Japanese (11.7%, a difference of 0.020%), Liberian (11.8%, a difference of 0.030%), Alsatian (11.7%, a difference of 0.080%), Subsaharan African (11.8%, a difference of 0.15%), and Immigrants from Congo (11.7%, a difference of 0.24%).
| Demographics | Rating | Rank | Male Disability |
| Immigrants | Dominican Republic | 4.9 /100 | #216 | Tragic 11.7% |
| Immigrants | Dominica | 4.6 /100 | #217 | Tragic 11.7% |
| Immigrants | England | 4.0 /100 | #218 | Tragic 11.7% |
| Panamanians | 3.8 /100 | #219 | Tragic 11.7% |
| Immigrants | Western Europe | 3.8 /100 | #220 | Tragic 11.7% |
| Immigrants | Congo | 3.7 /100 | #221 | Tragic 11.7% |
| Alsatians | 3.3 /100 | #222 | Tragic 11.7% |
| Immigrants | Bahamas | 3.2 /100 | #223 | Tragic 11.7% |
| Japanese | 3.1 /100 | #224 | Tragic 11.7% |
| Liberians | 3.1 /100 | #225 | Tragic 11.8% |
| Sub-Saharan Africans | 2.8 /100 | #226 | Tragic 11.8% |
| Austrians | 2.5 /100 | #227 | Tragic 11.8% |
| Hispanics or Latinos | 2.3 /100 | #228 | Tragic 11.8% |
| Bermudans | 2.3 /100 | #229 | Tragic 11.8% |
| Croatians | 2.1 /100 | #230 | Tragic 11.8% |
Demographics Similar to Asians by Male Disability
In terms of male disability, the demographic groups most similar to Asians are Immigrants from Sri Lanka (10.0%, a difference of 0.060%), Burmese (10.0%, a difference of 0.11%), Immigrants from Venezuela (10.0%, a difference of 0.39%), Cypriot (10.0%, a difference of 0.49%), and Immigrants from Asia (10.0%, a difference of 0.62%).
| Demographics | Rating | Rank | Male Disability |
| Iranians | 100.0 /100 | #13 | Exceptional 9.7% |
| Immigrants | Iran | 100.0 /100 | #14 | Exceptional 9.7% |
| Indians (Asian) | 100.0 /100 | #15 | Exceptional 9.7% |
| Okinawans | 100.0 /100 | #16 | Exceptional 9.8% |
| Immigrants | Korea | 100.0 /100 | #17 | Exceptional 9.8% |
| Immigrants | Pakistan | 100.0 /100 | #18 | Exceptional 9.8% |
| Immigrants | Sri Lanka | 100.0 /100 | #19 | Exceptional 10.0% |
| Asians | 100.0 /100 | #20 | Exceptional 10.0% |
| Burmese | 100.0 /100 | #21 | Exceptional 10.0% |
| Immigrants | Venezuela | 100.0 /100 | #22 | Exceptional 10.0% |
| Cypriots | 100.0 /100 | #23 | Exceptional 10.0% |
| Immigrants | Asia | 100.0 /100 | #24 | Exceptional 10.0% |
| Immigrants | Malaysia | 99.9 /100 | #25 | Exceptional 10.0% |
| Paraguayans | 99.9 /100 | #26 | Exceptional 10.1% |
| Egyptians | 99.9 /100 | #27 | Exceptional 10.1% |