Immigrants vs Asian Median Female Earnings
COMPARE
Immigrants
Asian
Median Female Earnings
Median Female Earnings Comparison
Immigrants
Asians
$39,328
MEDIAN FEMALE EARNINGS
31.7/ 100
METRIC RATING
192nd/ 347
METRIC RANK
$44,586
MEDIAN FEMALE EARNINGS
100.0/ 100
METRIC RATING
30th/ 347
METRIC RANK
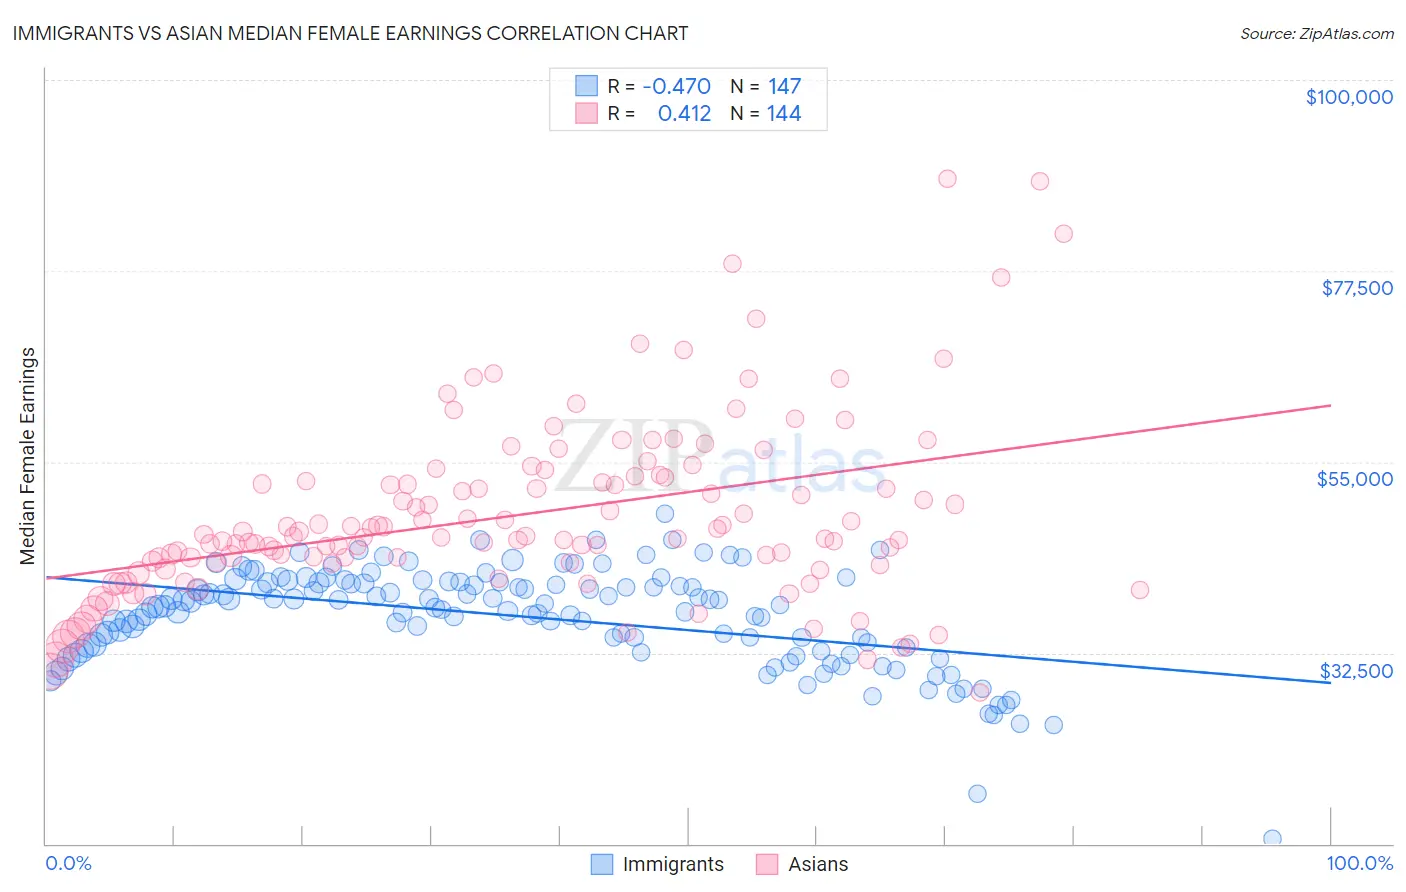
Immigrants vs Asian Median Female Earnings Correlation Chart
The statistical analysis conducted on geographies consisting of 575,241,597 people shows a moderate negative correlation between the proportion of Immigrants and median female earnings in the United States with a correlation coefficient (R) of -0.470 and weighted average of $39,328. Similarly, the statistical analysis conducted on geographies consisting of 549,997,902 people shows a moderate positive correlation between the proportion of Asians and median female earnings in the United States with a correlation coefficient (R) of 0.412 and weighted average of $44,586, a difference of 13.4%.
Median Female Earnings Correlation Summary
| Measurement | Immigrants | Asian |
| Minimum | $10,532 | $27,791 |
| Maximum | $48,847 | $88,421 |
| Range | $38,315 | $60,630 |
| Mean | $36,737 | $48,672 |
| Median | $38,007 | $46,136 |
| Interquartile 25% (IQ1) | $33,067 | $43,055 |
| Interquartile 75% (IQ3) | $40,787 | $52,970 |
| Interquartile Range (IQR) | $7,720 | $9,915 |
| Standard Deviation (Sample) | $5,900 | $10,662 |
| Standard Deviation (Population) | $5,880 | $10,625 |
Similar Demographics by Median Female Earnings
Demographics Similar to Immigrants by Median Female Earnings
In terms of median female earnings, the demographic groups most similar to Immigrants are Immigrants from Western Africa ($39,351, a difference of 0.060%), Immigrants from Nigeria ($39,294, a difference of 0.090%), Irish ($39,291, a difference of 0.090%), Puget Sound Salish ($39,376, a difference of 0.12%), and Senegalese ($39,384, a difference of 0.14%).
| Demographics | Rating | Rank | Median Female Earnings |
| Immigrants | West Indies | 36.9 /100 | #185 | Fair $39,441 |
| Colombians | 36.9 /100 | #186 | Fair $39,439 |
| Swedes | 36.0 /100 | #187 | Fair $39,421 |
| Bermudans | 35.9 /100 | #188 | Fair $39,418 |
| Senegalese | 34.2 /100 | #189 | Fair $39,384 |
| Puget Sound Salish | 33.9 /100 | #190 | Fair $39,376 |
| Immigrants | Western Africa | 32.7 /100 | #191 | Fair $39,351 |
| Immigrants | Immigrants | 31.7 /100 | #192 | Fair $39,328 |
| Immigrants | Nigeria | 30.2 /100 | #193 | Fair $39,294 |
| Irish | 30.0 /100 | #194 | Fair $39,291 |
| Uruguayans | 27.3 /100 | #195 | Fair $39,228 |
| Immigrants | Costa Rica | 25.6 /100 | #196 | Fair $39,186 |
| Assyrians/Chaldeans/Syriacs | 24.6 /100 | #197 | Fair $39,159 |
| Ecuadorians | 23.0 /100 | #198 | Fair $39,117 |
| Icelanders | 22.7 /100 | #199 | Fair $39,109 |
Demographics Similar to Asians by Median Female Earnings
In terms of median female earnings, the demographic groups most similar to Asians are Immigrants from Belgium ($44,587, a difference of 0.0%), Immigrants from France ($44,541, a difference of 0.10%), Immigrants from Russia ($44,680, a difference of 0.21%), Turkish ($44,695, a difference of 0.24%), and Immigrants from Belarus ($44,757, a difference of 0.38%).
| Demographics | Rating | Rank | Median Female Earnings |
| Burmese | 100.0 /100 | #23 | Exceptional $44,911 |
| Immigrants | Korea | 100.0 /100 | #24 | Exceptional $44,847 |
| Immigrants | Sweden | 100.0 /100 | #25 | Exceptional $44,774 |
| Immigrants | Belarus | 100.0 /100 | #26 | Exceptional $44,757 |
| Turks | 100.0 /100 | #27 | Exceptional $44,695 |
| Immigrants | Russia | 100.0 /100 | #28 | Exceptional $44,680 |
| Immigrants | Belgium | 100.0 /100 | #29 | Exceptional $44,587 |
| Asians | 100.0 /100 | #30 | Exceptional $44,586 |
| Immigrants | France | 100.0 /100 | #31 | Exceptional $44,541 |
| Immigrants | Northern Europe | 100.0 /100 | #32 | Exceptional $44,366 |
| Immigrants | Asia | 100.0 /100 | #33 | Exceptional $44,198 |
| Russians | 100.0 /100 | #34 | Exceptional $44,169 |
| Immigrants | Sri Lanka | 100.0 /100 | #35 | Exceptional $44,161 |
| Immigrants | Turkey | 100.0 /100 | #36 | Exceptional $44,066 |
| Immigrants | Switzerland | 100.0 /100 | #37 | Exceptional $43,996 |