Immigrants from Zimbabwe vs Finnish Hearing Disability
COMPARE
Immigrants from Zimbabwe
Finnish
Hearing Disability
Hearing Disability Comparison
Immigrants from Zimbabwe
Finns
3.0%
HEARING DISABILITY
64.2/ 100
METRIC RATING
165th/ 347
METRIC RANK
3.7%
HEARING DISABILITY
0.0/ 100
METRIC RATING
291st/ 347
METRIC RANK
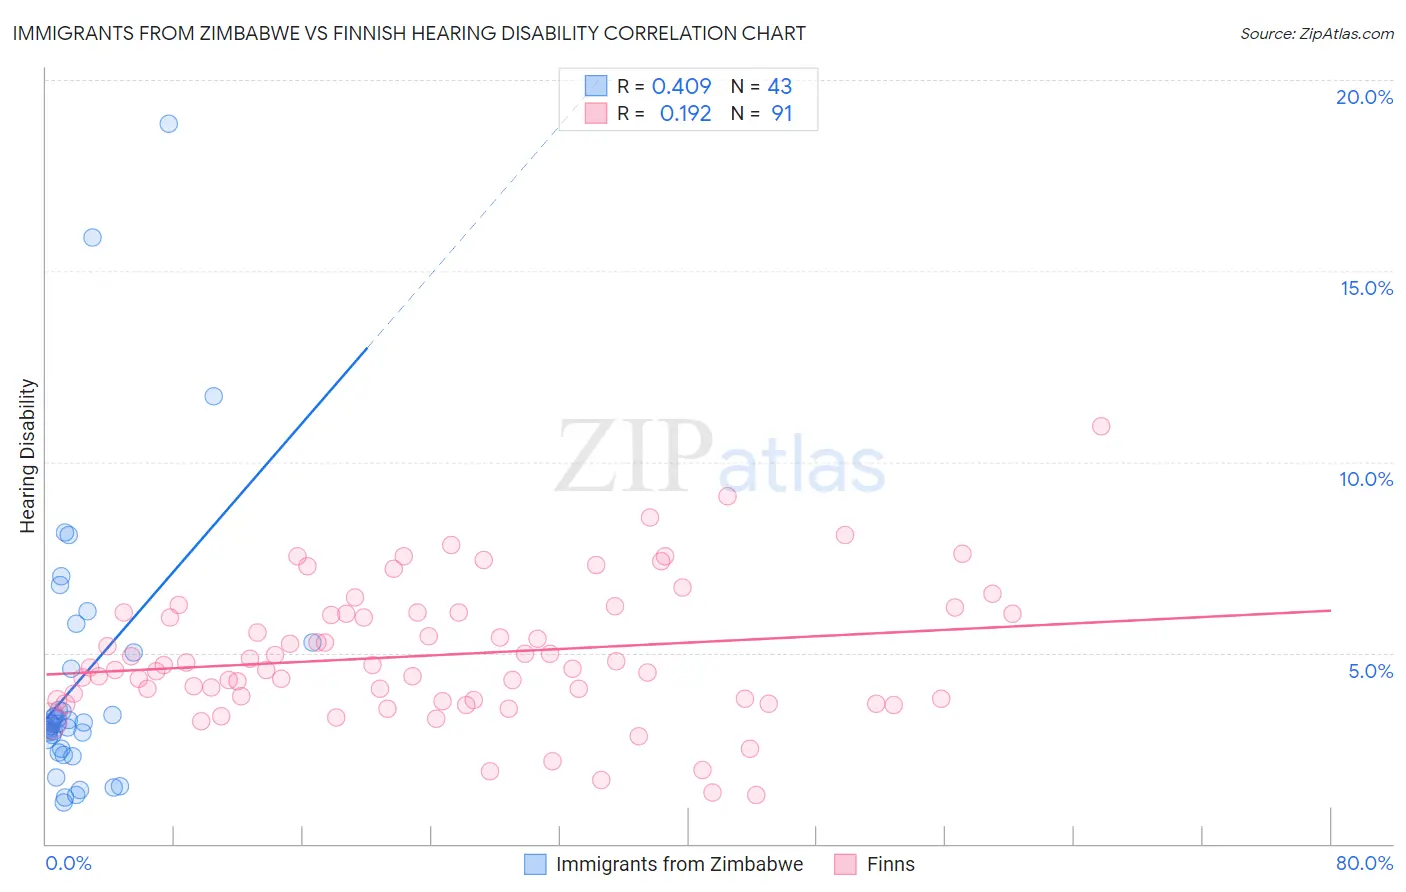
Immigrants from Zimbabwe vs Finnish Hearing Disability Correlation Chart
The statistical analysis conducted on geographies consisting of 117,807,709 people shows a moderate positive correlation between the proportion of Immigrants from Zimbabwe and percentage of population with hearing disability in the United States with a correlation coefficient (R) of 0.409 and weighted average of 3.0%. Similarly, the statistical analysis conducted on geographies consisting of 404,503,893 people shows a poor positive correlation between the proportion of Finns and percentage of population with hearing disability in the United States with a correlation coefficient (R) of 0.192 and weighted average of 3.7%, a difference of 24.7%.
Hearing Disability Correlation Summary
| Measurement | Immigrants from Zimbabwe | Finnish |
| Minimum | 1.1% | 1.3% |
| Maximum | 18.9% | 10.9% |
| Range | 17.8% | 9.7% |
| Mean | 4.3% | 4.9% |
| Median | 3.2% | 4.6% |
| Interquartile 25% (IQ1) | 2.5% | 3.8% |
| Interquartile 75% (IQ3) | 5.0% | 6.0% |
| Interquartile Range (IQR) | 2.5% | 2.3% |
| Standard Deviation (Sample) | 3.6% | 1.8% |
| Standard Deviation (Population) | 3.6% | 1.8% |
Similar Demographics by Hearing Disability
Demographics Similar to Immigrants from Zimbabwe by Hearing Disability
In terms of hearing disability, the demographic groups most similar to Immigrants from Zimbabwe are Immigrants from Cambodia (3.0%, a difference of 0.060%), Immigrants from Central America (3.0%, a difference of 0.080%), Immigrants from South Eastern Asia (3.0%, a difference of 0.14%), Immigrants from Japan (2.9%, a difference of 0.22%), and Albanian (2.9%, a difference of 0.25%).
| Demographics | Rating | Rank | Hearing Disability |
| Immigrants | Burma/Myanmar | 69.5 /100 | #158 | Good 2.9% |
| Immigrants | Australia | 67.4 /100 | #159 | Good 2.9% |
| Immigrants | Fiji | 67.1 /100 | #160 | Good 2.9% |
| Albanians | 66.6 /100 | #161 | Good 2.9% |
| Immigrants | Japan | 66.3 /100 | #162 | Good 2.9% |
| Immigrants | Central America | 64.9 /100 | #163 | Good 3.0% |
| Immigrants | Cambodia | 64.8 /100 | #164 | Good 3.0% |
| Immigrants | Zimbabwe | 64.2 /100 | #165 | Good 3.0% |
| Immigrants | South Eastern Asia | 62.9 /100 | #166 | Good 3.0% |
| Immigrants | Eastern Europe | 58.1 /100 | #167 | Average 3.0% |
| Immigrants | Greece | 57.9 /100 | #168 | Average 3.0% |
| Arabs | 57.6 /100 | #169 | Average 3.0% |
| Immigrants | Cabo Verde | 56.9 /100 | #170 | Average 3.0% |
| Immigrants | Ukraine | 56.6 /100 | #171 | Average 3.0% |
| Armenians | 56.0 /100 | #172 | Average 3.0% |
Demographics Similar to Finns by Hearing Disability
In terms of hearing disability, the demographic groups most similar to Finns are White/Caucasian (3.7%, a difference of 0.010%), Native Hawaiian (3.7%, a difference of 0.060%), Norwegian (3.7%, a difference of 0.12%), Chinese (3.7%, a difference of 0.15%), and Irish (3.7%, a difference of 0.35%).
| Demographics | Rating | Rank | Hearing Disability |
| Immigrants | Micronesia | 0.0 /100 | #284 | Tragic 3.6% |
| Sioux | 0.0 /100 | #285 | Tragic 3.6% |
| Delaware | 0.0 /100 | #286 | Tragic 3.6% |
| Spanish | 0.0 /100 | #287 | Tragic 3.7% |
| Irish | 0.0 /100 | #288 | Tragic 3.7% |
| Chinese | 0.0 /100 | #289 | Tragic 3.7% |
| Whites/Caucasians | 0.0 /100 | #290 | Tragic 3.7% |
| Finns | 0.0 /100 | #291 | Tragic 3.7% |
| Native Hawaiians | 0.0 /100 | #292 | Tragic 3.7% |
| Norwegians | 0.0 /100 | #293 | Tragic 3.7% |
| Iroquois | 0.0 /100 | #294 | Tragic 3.7% |
| Welsh | 0.0 /100 | #295 | Tragic 3.7% |
| Pima | 0.0 /100 | #296 | Tragic 3.7% |
| Immigrants | Azores | 0.0 /100 | #297 | Tragic 3.7% |
| Celtics | 0.0 /100 | #298 | Tragic 3.7% |