Immigrants from Zimbabwe vs Serbian Cognitive Disability
COMPARE
Immigrants from Zimbabwe
Serbian
Cognitive Disability
Cognitive Disability Comparison
Immigrants from Zimbabwe
Serbians
17.5%
COGNITIVE DISABILITY
11.0/ 100
METRIC RATING
204th/ 347
METRIC RANK
16.7%
COGNITIVE DISABILITY
99.1/ 100
METRIC RATING
83rd/ 347
METRIC RANK
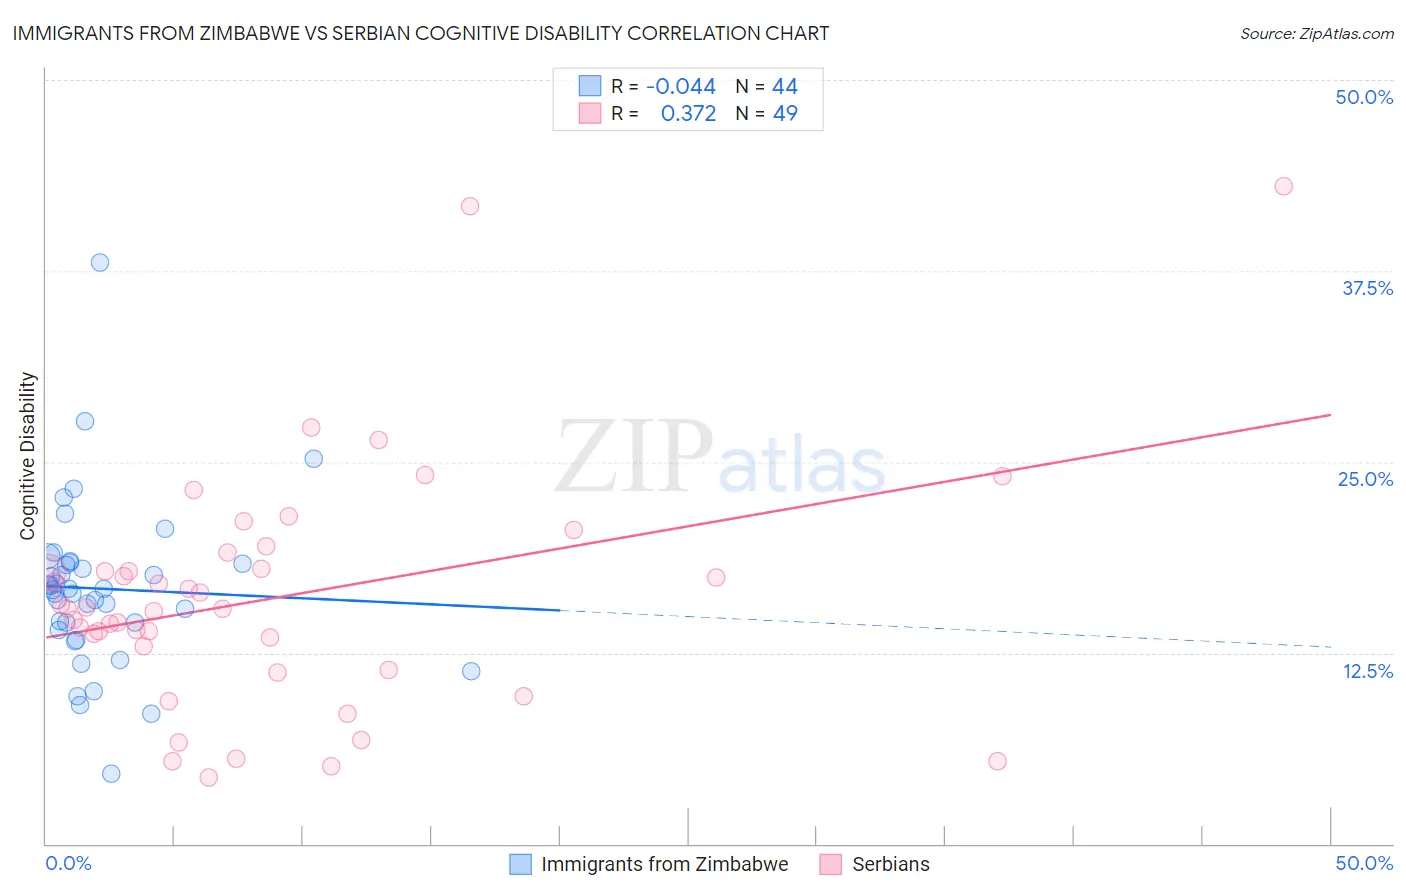
Immigrants from Zimbabwe vs Serbian Cognitive Disability Correlation Chart
The statistical analysis conducted on geographies consisting of 117,811,650 people shows no correlation between the proportion of Immigrants from Zimbabwe and percentage of population with cognitive disability in the United States with a correlation coefficient (R) of -0.044 and weighted average of 17.5%. Similarly, the statistical analysis conducted on geographies consisting of 267,644,527 people shows a mild positive correlation between the proportion of Serbians and percentage of population with cognitive disability in the United States with a correlation coefficient (R) of 0.372 and weighted average of 16.7%, a difference of 5.0%.
Cognitive Disability Correlation Summary
| Measurement | Immigrants from Zimbabwe | Serbian |
| Minimum | 4.6% | 4.3% |
| Maximum | 38.0% | 43.1% |
| Range | 33.5% | 38.7% |
| Mean | 16.7% | 16.1% |
| Median | 16.7% | 15.4% |
| Interquartile 25% (IQ1) | 14.2% | 12.1% |
| Interquartile 75% (IQ3) | 18.4% | 18.6% |
| Interquartile Range (IQR) | 4.2% | 6.4% |
| Standard Deviation (Sample) | 5.5% | 7.8% |
| Standard Deviation (Population) | 5.4% | 7.7% |
Similar Demographics by Cognitive Disability
Demographics Similar to Immigrants from Zimbabwe by Cognitive Disability
In terms of cognitive disability, the demographic groups most similar to Immigrants from Zimbabwe are Immigrants from Caribbean (17.5%, a difference of 0.0%), Puget Sound Salish (17.5%, a difference of 0.010%), Alaska Native (17.5%, a difference of 0.040%), Immigrants from Morocco (17.5%, a difference of 0.070%), and Immigrants from Latin America (17.6%, a difference of 0.10%).
| Demographics | Rating | Rank | Cognitive Disability |
| Immigrants | Afghanistan | 16.7 /100 | #197 | Poor 17.5% |
| Immigrants | Panama | 14.8 /100 | #198 | Poor 17.5% |
| Immigrants | Singapore | 14.3 /100 | #199 | Poor 17.5% |
| Haitians | 14.1 /100 | #200 | Poor 17.5% |
| South American Indians | 13.0 /100 | #201 | Poor 17.5% |
| Immigrants | Morocco | 12.0 /100 | #202 | Poor 17.5% |
| Immigrants | Caribbean | 11.0 /100 | #203 | Poor 17.5% |
| Immigrants | Zimbabwe | 11.0 /100 | #204 | Poor 17.5% |
| Puget Sound Salish | 10.9 /100 | #205 | Poor 17.5% |
| Alaska Natives | 10.4 /100 | #206 | Poor 17.5% |
| Immigrants | Latin America | 9.7 /100 | #207 | Tragic 17.6% |
| Immigrants | Cameroon | 9.3 /100 | #208 | Tragic 17.6% |
| Immigrants | Trinidad and Tobago | 8.7 /100 | #209 | Tragic 17.6% |
| Immigrants | Jamaica | 8.5 /100 | #210 | Tragic 17.6% |
| Taiwanese | 7.7 /100 | #211 | Tragic 17.6% |
Demographics Similar to Serbians by Cognitive Disability
In terms of cognitive disability, the demographic groups most similar to Serbians are Belgian (16.7%, a difference of 0.020%), Immigrants from Moldova (16.7%, a difference of 0.030%), Swiss (16.7%, a difference of 0.070%), Immigrants from South Africa (16.7%, a difference of 0.070%), and Native Hawaiian (16.7%, a difference of 0.080%).
| Demographics | Rating | Rank | Cognitive Disability |
| Immigrants | Serbia | 99.3 /100 | #76 | Exceptional 16.7% |
| Immigrants | Hungary | 99.3 /100 | #77 | Exceptional 16.7% |
| Peruvians | 99.3 /100 | #78 | Exceptional 16.7% |
| Immigrants | Bulgaria | 99.3 /100 | #79 | Exceptional 16.7% |
| Egyptians | 99.2 /100 | #80 | Exceptional 16.7% |
| Immigrants | Netherlands | 99.2 /100 | #81 | Exceptional 16.7% |
| Swiss | 99.2 /100 | #82 | Exceptional 16.7% |
| Serbians | 99.1 /100 | #83 | Exceptional 16.7% |
| Belgians | 99.1 /100 | #84 | Exceptional 16.7% |
| Immigrants | Moldova | 99.1 /100 | #85 | Exceptional 16.7% |
| Immigrants | South Africa | 99.0 /100 | #86 | Exceptional 16.7% |
| Native Hawaiians | 99.0 /100 | #87 | Exceptional 16.7% |
| Immigrants | Philippines | 99.0 /100 | #88 | Exceptional 16.7% |
| Immigrants | Egypt | 98.8 /100 | #89 | Exceptional 16.7% |
| South Americans | 98.8 /100 | #90 | Exceptional 16.7% |