Cherokee vs Argentinean Female Disability
COMPARE
Cherokee
Argentinean
Female Disability
Female Disability Comparison
Cherokee
Argentineans
14.9%
FEMALE DISABILITY
0.0/ 100
METRIC RATING
334th/ 347
METRIC RANK
11.0%
FEMALE DISABILITY
100.0/ 100
METRIC RATING
26th/ 347
METRIC RANK
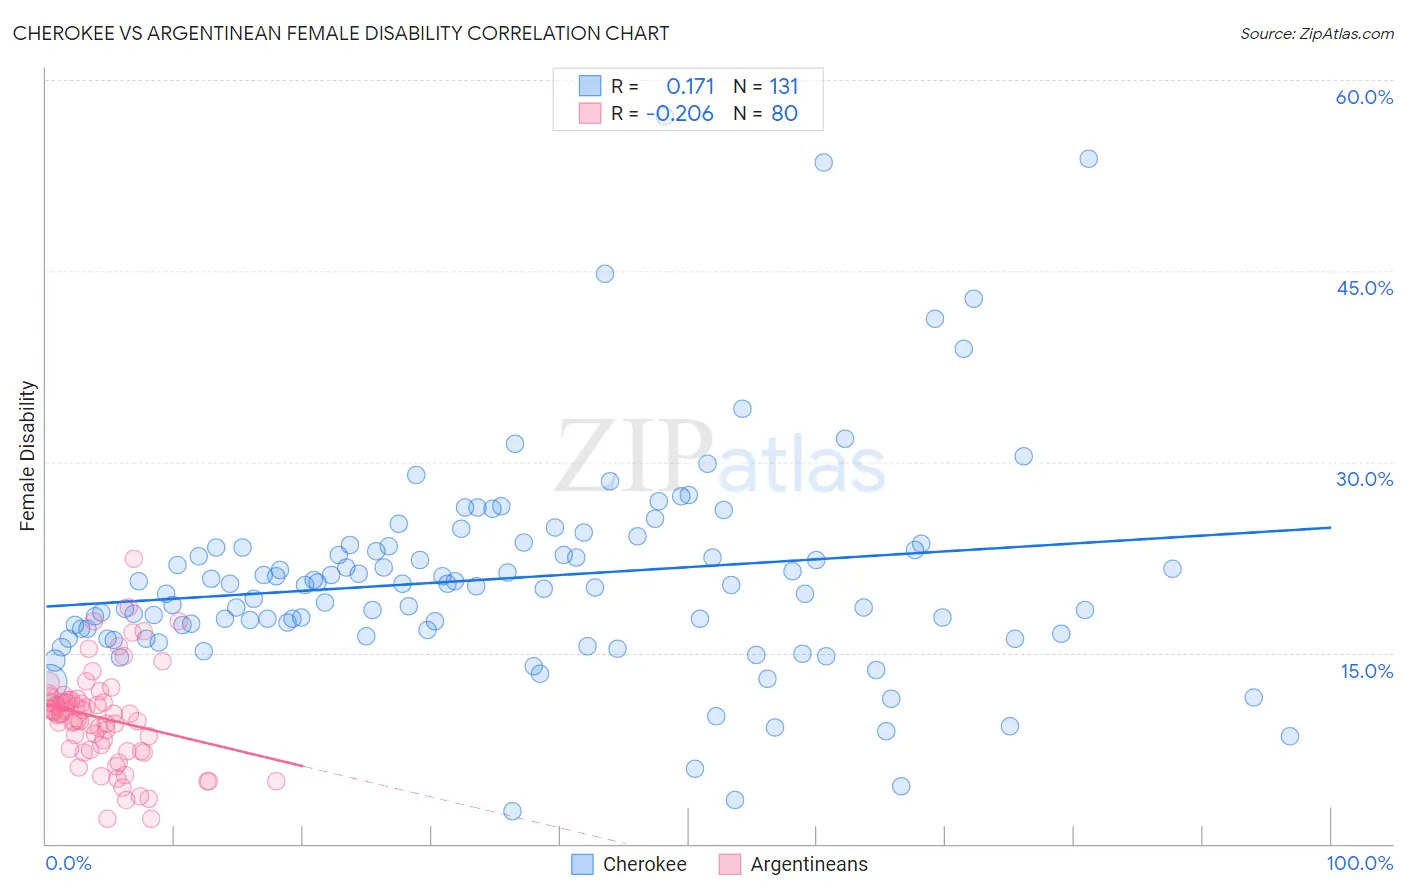
Cherokee vs Argentinean Female Disability Correlation Chart
The statistical analysis conducted on geographies consisting of 493,548,902 people shows a poor positive correlation between the proportion of Cherokee and percentage of females with a disability in the United States with a correlation coefficient (R) of 0.171 and weighted average of 14.9%. Similarly, the statistical analysis conducted on geographies consisting of 297,133,447 people shows a weak negative correlation between the proportion of Argentineans and percentage of females with a disability in the United States with a correlation coefficient (R) of -0.206 and weighted average of 11.0%, a difference of 34.9%.
Female Disability Correlation Summary
| Measurement | Cherokee | Argentinean |
| Minimum | 2.6% | 1.9% |
| Maximum | 57.1% | 22.3% |
| Range | 54.6% | 20.4% |
| Mean | 20.9% | 9.9% |
| Median | 20.2% | 10.2% |
| Interquartile 25% (IQ1) | 16.5% | 7.4% |
| Interquartile 75% (IQ3) | 23.3% | 11.3% |
| Interquartile Range (IQR) | 6.8% | 3.9% |
| Standard Deviation (Sample) | 8.5% | 3.8% |
| Standard Deviation (Population) | 8.5% | 3.7% |
Similar Demographics by Female Disability
Demographics Similar to Cherokee by Female Disability
In terms of female disability, the demographic groups most similar to Cherokee are Cajun (14.9%, a difference of 0.020%), Immigrants from the Azores (14.9%, a difference of 0.090%), Pima (14.8%, a difference of 0.48%), Seminole (15.0%, a difference of 0.69%), and Tohono O'odham (15.0%, a difference of 0.82%).
| Demographics | Rating | Rank | Female Disability |
| Ottawa | 0.0 /100 | #327 | Tragic 14.2% |
| Cape Verdeans | 0.0 /100 | #328 | Tragic 14.2% |
| Osage | 0.0 /100 | #329 | Tragic 14.3% |
| Yuman | 0.0 /100 | #330 | Tragic 14.5% |
| Immigrants | Cabo Verde | 0.0 /100 | #331 | Tragic 14.6% |
| Pima | 0.0 /100 | #332 | Tragic 14.8% |
| Immigrants | Azores | 0.0 /100 | #333 | Tragic 14.9% |
| Cherokee | 0.0 /100 | #334 | Tragic 14.9% |
| Cajuns | 0.0 /100 | #335 | Tragic 14.9% |
| Seminole | 0.0 /100 | #336 | Tragic 15.0% |
| Tohono O'odham | 0.0 /100 | #337 | Tragic 15.0% |
| Dutch West Indians | 0.0 /100 | #338 | Tragic 15.0% |
| Colville | 0.0 /100 | #339 | Tragic 15.1% |
| Chickasaw | 0.0 /100 | #340 | Tragic 15.2% |
| Choctaw | 0.0 /100 | #341 | Tragic 15.4% |
Demographics Similar to Argentineans by Female Disability
In terms of female disability, the demographic groups most similar to Argentineans are Immigrants from Asia (11.0%, a difference of 0.040%), Immigrants from Argentina (11.0%, a difference of 0.070%), Immigrants from Turkey (11.1%, a difference of 0.40%), Venezuelan (11.0%, a difference of 0.64%), and Egyptian (11.1%, a difference of 0.67%).
| Demographics | Rating | Rank | Female Disability |
| Immigrants | Venezuela | 100.0 /100 | #19 | Exceptional 10.9% |
| Immigrants | Pakistan | 100.0 /100 | #20 | Exceptional 10.9% |
| Asians | 100.0 /100 | #21 | Exceptional 10.9% |
| Immigrants | Sri Lanka | 100.0 /100 | #22 | Exceptional 10.9% |
| Venezuelans | 100.0 /100 | #23 | Exceptional 11.0% |
| Immigrants | Argentina | 100.0 /100 | #24 | Exceptional 11.0% |
| Immigrants | Asia | 100.0 /100 | #25 | Exceptional 11.0% |
| Argentineans | 100.0 /100 | #26 | Exceptional 11.0% |
| Immigrants | Turkey | 100.0 /100 | #27 | Exceptional 11.1% |
| Egyptians | 100.0 /100 | #28 | Exceptional 11.1% |
| Immigrants | Malaysia | 100.0 /100 | #29 | Exceptional 11.1% |
| Turks | 100.0 /100 | #30 | Exceptional 11.1% |
| Immigrants | Kuwait | 100.0 /100 | #31 | Exceptional 11.1% |
| Immigrants | Australia | 100.0 /100 | #32 | Exceptional 11.1% |
| Immigrants | Egypt | 100.0 /100 | #33 | Exceptional 11.1% |