Ghanaian vs Argentinean Female Disability
COMPARE
Ghanaian
Argentinean
Female Disability
Female Disability Comparison
Ghanaians
Argentineans
12.1%
FEMALE DISABILITY
76.6/ 100
METRIC RATING
155th/ 347
METRIC RANK
11.0%
FEMALE DISABILITY
100.0/ 100
METRIC RATING
26th/ 347
METRIC RANK
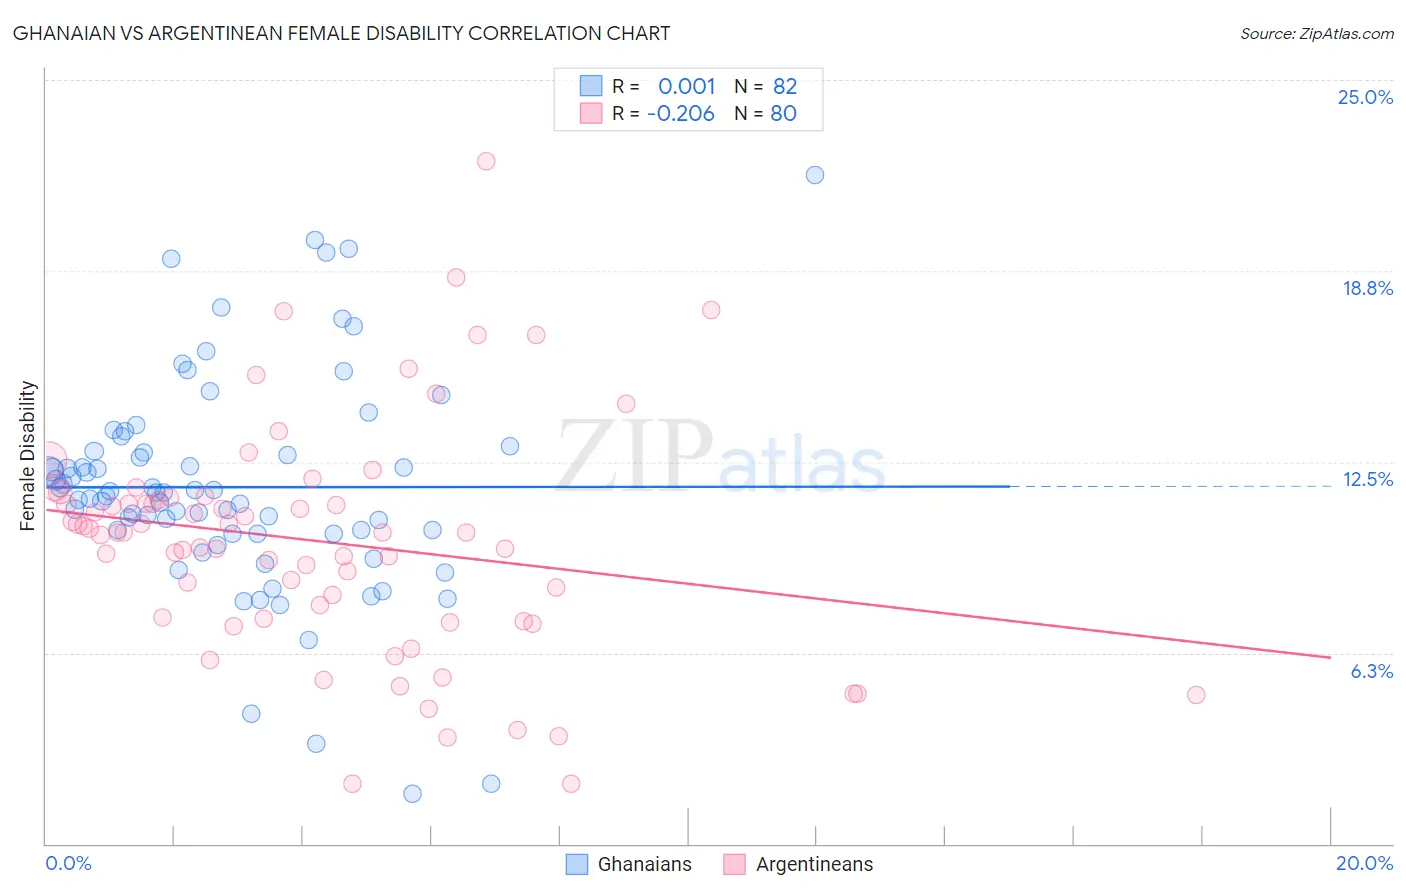
Ghanaian vs Argentinean Female Disability Correlation Chart
The statistical analysis conducted on geographies consisting of 190,696,570 people shows no correlation between the proportion of Ghanaians and percentage of females with a disability in the United States with a correlation coefficient (R) of 0.001 and weighted average of 12.1%. Similarly, the statistical analysis conducted on geographies consisting of 297,133,447 people shows a weak negative correlation between the proportion of Argentineans and percentage of females with a disability in the United States with a correlation coefficient (R) of -0.206 and weighted average of 11.0%, a difference of 9.4%.
Female Disability Correlation Summary
| Measurement | Ghanaian | Argentinean |
| Minimum | 1.6% | 1.9% |
| Maximum | 21.9% | 22.3% |
| Range | 20.2% | 20.4% |
| Mean | 11.7% | 9.9% |
| Median | 11.5% | 10.2% |
| Interquartile 25% (IQ1) | 10.2% | 7.4% |
| Interquartile 75% (IQ3) | 12.9% | 11.3% |
| Interquartile Range (IQR) | 2.7% | 3.9% |
| Standard Deviation (Sample) | 3.6% | 3.8% |
| Standard Deviation (Population) | 3.6% | 3.7% |
Similar Demographics by Female Disability
Demographics Similar to Ghanaians by Female Disability
In terms of female disability, the demographic groups most similar to Ghanaians are Syrian (12.1%, a difference of 0.020%), Sudanese (12.0%, a difference of 0.14%), Immigrants from Scotland (12.0%, a difference of 0.15%), Moroccan (12.1%, a difference of 0.19%), and Danish (12.1%, a difference of 0.20%).
| Demographics | Rating | Rank | Female Disability |
| Immigrants | Kenya | 83.1 /100 | #148 | Excellent 12.0% |
| Greeks | 82.0 /100 | #149 | Excellent 12.0% |
| Immigrants | Moldova | 81.4 /100 | #150 | Excellent 12.0% |
| Icelanders | 80.7 /100 | #151 | Excellent 12.0% |
| Immigrants | Scotland | 79.3 /100 | #152 | Good 12.0% |
| Sudanese | 79.1 /100 | #153 | Good 12.0% |
| Syrians | 76.9 /100 | #154 | Good 12.1% |
| Ghanaians | 76.6 /100 | #155 | Good 12.1% |
| Moroccans | 72.9 /100 | #156 | Good 12.1% |
| Danes | 72.5 /100 | #157 | Good 12.1% |
| Immigrants | Middle Africa | 72.4 /100 | #158 | Good 12.1% |
| Immigrants | Central America | 67.7 /100 | #159 | Good 12.1% |
| Immigrants | Guatemala | 66.0 /100 | #160 | Good 12.1% |
| Guyanese | 64.7 /100 | #161 | Good 12.1% |
| Immigrants | Ukraine | 64.3 /100 | #162 | Good 12.1% |
Demographics Similar to Argentineans by Female Disability
In terms of female disability, the demographic groups most similar to Argentineans are Immigrants from Asia (11.0%, a difference of 0.040%), Immigrants from Argentina (11.0%, a difference of 0.070%), Immigrants from Turkey (11.1%, a difference of 0.40%), Venezuelan (11.0%, a difference of 0.64%), and Egyptian (11.1%, a difference of 0.67%).
| Demographics | Rating | Rank | Female Disability |
| Immigrants | Venezuela | 100.0 /100 | #19 | Exceptional 10.9% |
| Immigrants | Pakistan | 100.0 /100 | #20 | Exceptional 10.9% |
| Asians | 100.0 /100 | #21 | Exceptional 10.9% |
| Immigrants | Sri Lanka | 100.0 /100 | #22 | Exceptional 10.9% |
| Venezuelans | 100.0 /100 | #23 | Exceptional 11.0% |
| Immigrants | Argentina | 100.0 /100 | #24 | Exceptional 11.0% |
| Immigrants | Asia | 100.0 /100 | #25 | Exceptional 11.0% |
| Argentineans | 100.0 /100 | #26 | Exceptional 11.0% |
| Immigrants | Turkey | 100.0 /100 | #27 | Exceptional 11.1% |
| Egyptians | 100.0 /100 | #28 | Exceptional 11.1% |
| Immigrants | Malaysia | 100.0 /100 | #29 | Exceptional 11.1% |
| Turks | 100.0 /100 | #30 | Exceptional 11.1% |
| Immigrants | Kuwait | 100.0 /100 | #31 | Exceptional 11.1% |
| Immigrants | Australia | 100.0 /100 | #32 | Exceptional 11.1% |
| Immigrants | Egypt | 100.0 /100 | #33 | Exceptional 11.1% |