Immigrants from Western Europe vs Immigrants from Taiwan Disability Age Under 5
COMPARE
Immigrants from Western Europe
Immigrants from Taiwan
Disability Age Under 5
Disability Age Under 5 Comparison
Immigrants from Western Europe
Immigrants from Taiwan
1.4%
DISABILITY AGE UNDER 5
0.5/ 100
METRIC RATING
256th/ 347
METRIC RANK
1.0%
DISABILITY AGE UNDER 5
100.0/ 100
METRIC RATING
26th/ 347
METRIC RANK
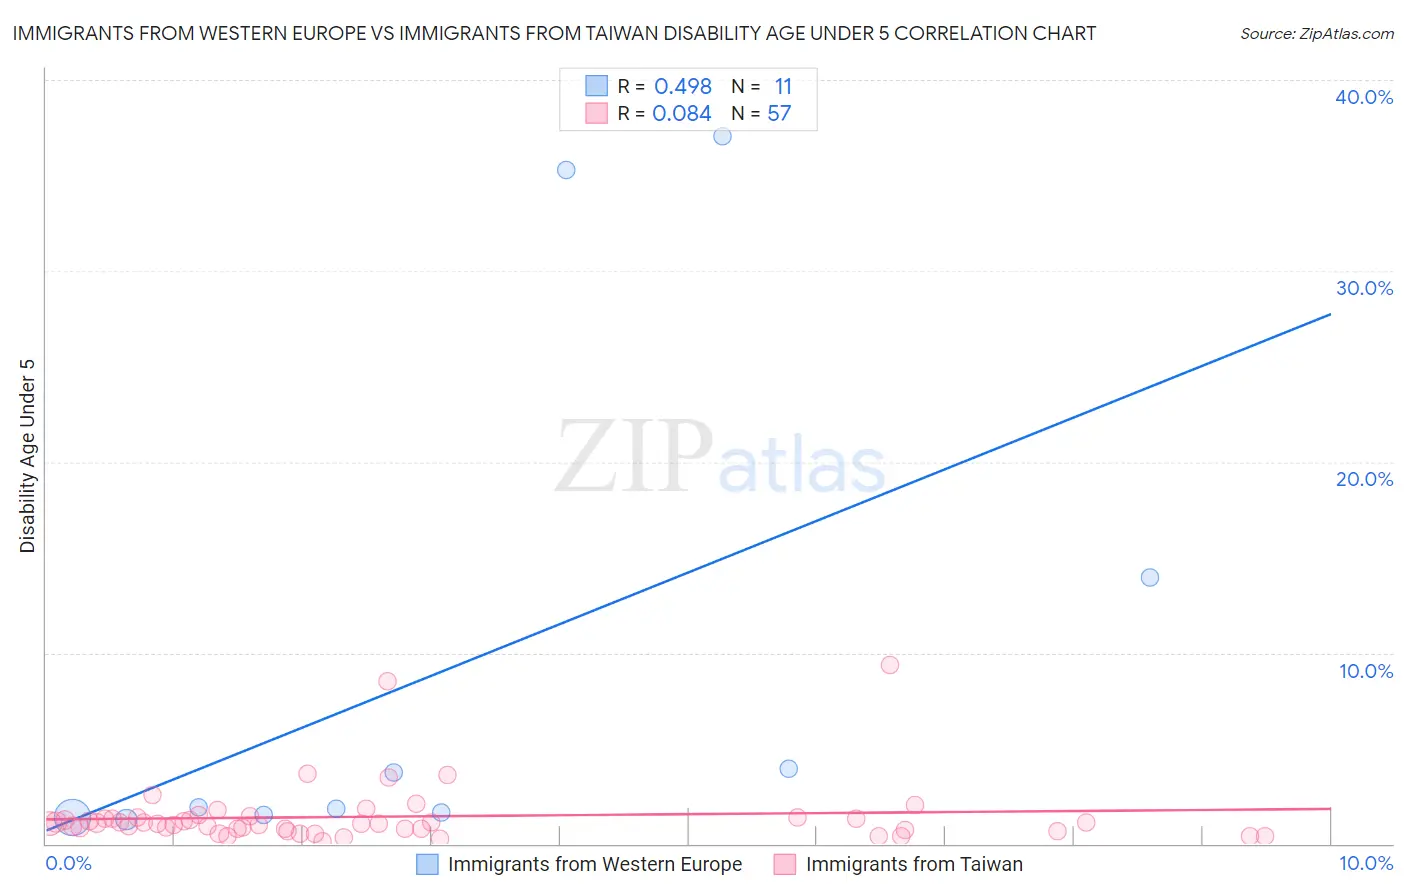
Immigrants from Western Europe vs Immigrants from Taiwan Disability Age Under 5 Correlation Chart
The statistical analysis conducted on geographies consisting of 244,253,357 people shows a moderate positive correlation between the proportion of Immigrants from Western Europe and percentage of population with a disability under the age of 5 in the United States with a correlation coefficient (R) of 0.498 and weighted average of 1.4%. Similarly, the statistical analysis conducted on geographies consisting of 173,979,803 people shows a slight positive correlation between the proportion of Immigrants from Taiwan and percentage of population with a disability under the age of 5 in the United States with a correlation coefficient (R) of 0.084 and weighted average of 1.0%, a difference of 37.9%.
Disability Age Under 5 Correlation Summary
| Measurement | Immigrants from Western Europe | Immigrants from Taiwan |
| Minimum | 1.3% | 0.13% |
| Maximum | 37.0% | 9.4% |
| Range | 35.8% | 9.2% |
| Mean | 9.4% | 1.4% |
| Median | 1.9% | 1.1% |
| Interquartile 25% (IQ1) | 1.5% | 0.73% |
| Interquartile 75% (IQ3) | 14.0% | 1.4% |
| Interquartile Range (IQR) | 12.4% | 0.63% |
| Standard Deviation (Sample) | 13.7% | 1.6% |
| Standard Deviation (Population) | 13.1% | 1.6% |
Similar Demographics by Disability Age Under 5
Demographics Similar to Immigrants from Western Europe by Disability Age Under 5
In terms of disability age under 5, the demographic groups most similar to Immigrants from Western Europe are Immigrants from Liberia (1.4%, a difference of 0.42%), Immigrants from Brazil (1.4%, a difference of 0.48%), Australian (1.4%, a difference of 0.56%), Slovene (1.4%, a difference of 0.89%), and Costa Rican (1.4%, a difference of 1.1%).
| Demographics | Rating | Rank | Disability Age Under 5 |
| Bermudans | 1.0 /100 | #249 | Tragic 1.4% |
| Africans | 1.0 /100 | #250 | Tragic 1.4% |
| Immigrants | Hungary | 1.0 /100 | #251 | Tragic 1.4% |
| Immigrants | Scotland | 0.9 /100 | #252 | Tragic 1.4% |
| Australians | 0.7 /100 | #253 | Tragic 1.4% |
| Immigrants | Brazil | 0.7 /100 | #254 | Tragic 1.4% |
| Immigrants | Liberia | 0.6 /100 | #255 | Tragic 1.4% |
| Immigrants | Western Europe | 0.5 /100 | #256 | Tragic 1.4% |
| Slovenes | 0.3 /100 | #257 | Tragic 1.4% |
| Costa Ricans | 0.3 /100 | #258 | Tragic 1.4% |
| Immigrants | Southern Europe | 0.3 /100 | #259 | Tragic 1.4% |
| Slavs | 0.3 /100 | #260 | Tragic 1.4% |
| Immigrants | Netherlands | 0.2 /100 | #261 | Tragic 1.4% |
| Immigrants | Dominica | 0.2 /100 | #262 | Tragic 1.4% |
| Spanish | 0.2 /100 | #263 | Tragic 1.4% |
Demographics Similar to Immigrants from Taiwan by Disability Age Under 5
In terms of disability age under 5, the demographic groups most similar to Immigrants from Taiwan are Immigrants from Micronesia (1.0%, a difference of 0.12%), Indian (Asian) (1.0%, a difference of 0.43%), Yakama (1.00%, a difference of 0.72%), Immigrants from Iran (1.00%, a difference of 0.79%), and Guyanese (1.0%, a difference of 0.84%).
| Demographics | Rating | Rank | Disability Age Under 5 |
| Puget Sound Salish | 100.0 /100 | #19 | Exceptional 0.97% |
| Nepalese | 100.0 /100 | #20 | Exceptional 0.97% |
| British West Indians | 100.0 /100 | #21 | Exceptional 0.99% |
| Immigrants | Iran | 100.0 /100 | #22 | Exceptional 1.00% |
| Yakama | 100.0 /100 | #23 | Exceptional 1.00% |
| Indians (Asian) | 100.0 /100 | #24 | Exceptional 1.0% |
| Immigrants | Micronesia | 100.0 /100 | #25 | Exceptional 1.0% |
| Immigrants | Taiwan | 100.0 /100 | #26 | Exceptional 1.0% |
| Guyanese | 100.0 /100 | #27 | Exceptional 1.0% |
| Immigrants | Eastern Asia | 100.0 /100 | #28 | Exceptional 1.0% |
| Immigrants | Belarus | 100.0 /100 | #29 | Exceptional 1.0% |
| Immigrants | South Central Asia | 99.9 /100 | #30 | Exceptional 1.0% |
| Armenians | 99.9 /100 | #31 | Exceptional 1.0% |
| Iranians | 99.9 /100 | #32 | Exceptional 1.0% |
| Bolivians | 99.9 /100 | #33 | Exceptional 1.0% |