Immigrants from Western Europe vs South American Indian Disability Age Under 5
COMPARE
Immigrants from Western Europe
South American Indian
Disability Age Under 5
Disability Age Under 5 Comparison
Immigrants from Western Europe
South American Indians
1.4%
DISABILITY AGE UNDER 5
0.5/ 100
METRIC RATING
256th/ 347
METRIC RANK
1.3%
DISABILITY AGE UNDER 5
3.3/ 100
METRIC RATING
236th/ 347
METRIC RANK
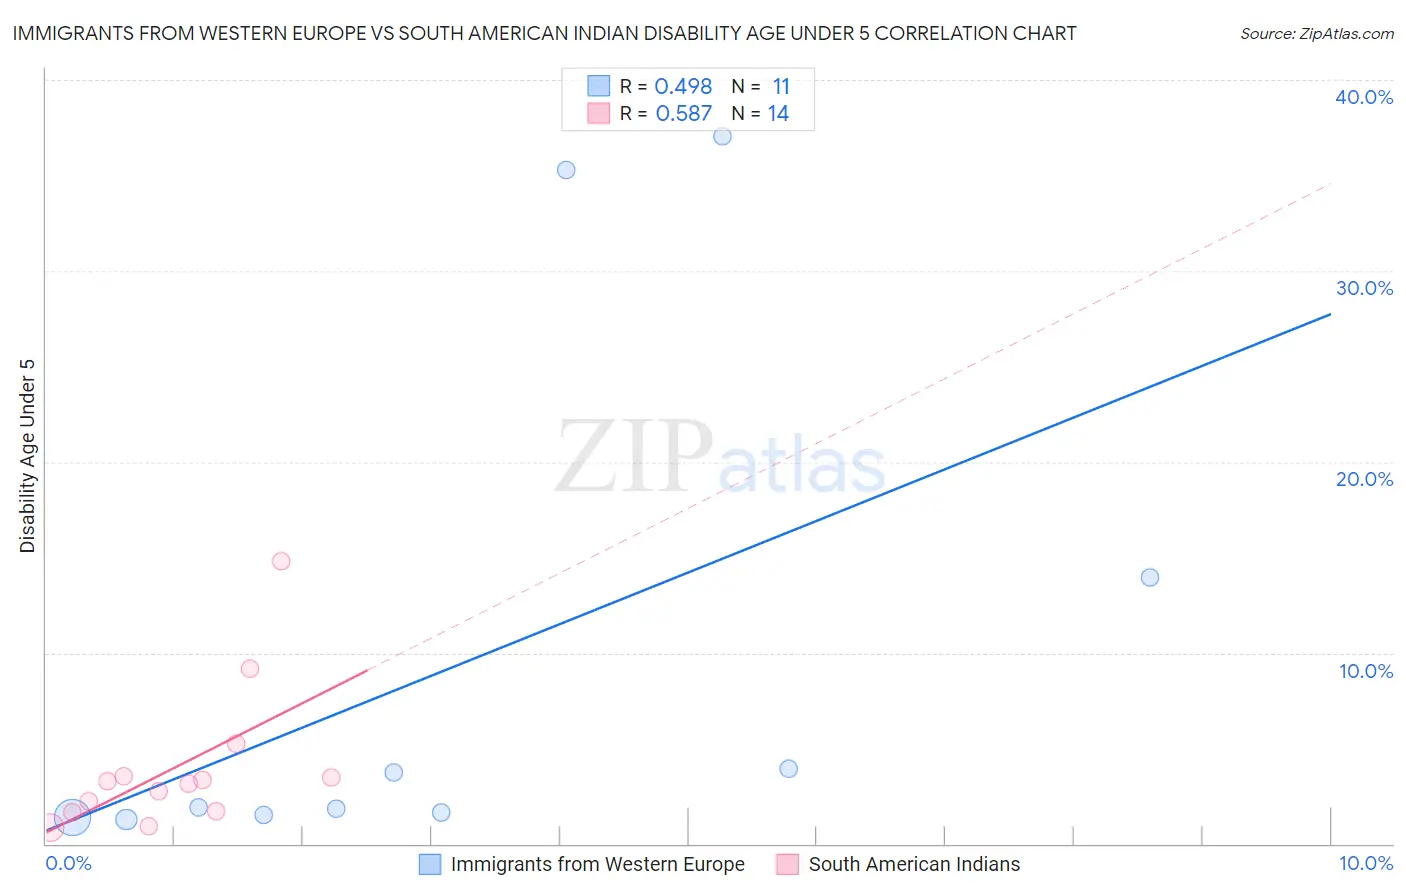
Immigrants from Western Europe vs South American Indian Disability Age Under 5 Correlation Chart
The statistical analysis conducted on geographies consisting of 244,253,357 people shows a moderate positive correlation between the proportion of Immigrants from Western Europe and percentage of population with a disability under the age of 5 in the United States with a correlation coefficient (R) of 0.498 and weighted average of 1.4%. Similarly, the statistical analysis conducted on geographies consisting of 114,062,078 people shows a substantial positive correlation between the proportion of South American Indians and percentage of population with a disability under the age of 5 in the United States with a correlation coefficient (R) of 0.587 and weighted average of 1.3%, a difference of 4.0%.
Disability Age Under 5 Correlation Summary
| Measurement | Immigrants from Western Europe | South American Indian |
| Minimum | 1.3% | 0.86% |
| Maximum | 37.0% | 14.8% |
| Range | 35.8% | 13.9% |
| Mean | 9.4% | 4.0% |
| Median | 1.9% | 3.2% |
| Interquartile 25% (IQ1) | 1.5% | 1.7% |
| Interquartile 75% (IQ3) | 14.0% | 3.6% |
| Interquartile Range (IQR) | 12.4% | 1.8% |
| Standard Deviation (Sample) | 13.7% | 3.7% |
| Standard Deviation (Population) | 13.1% | 3.6% |
Demographics Similar to Immigrants from Western Europe and South American Indians by Disability Age Under 5
In terms of disability age under 5, the demographic groups most similar to Immigrants from Western Europe are Immigrants from Liberia (1.4%, a difference of 0.42%), Immigrants from Brazil (1.4%, a difference of 0.48%), Australian (1.4%, a difference of 0.56%), Immigrants from Scotland (1.4%, a difference of 1.2%), and Immigrants from Hungary (1.4%, a difference of 1.3%). Similarly, the demographic groups most similar to South American Indians are Basque (1.3%, a difference of 0.24%), Spanish American Indian (1.3%, a difference of 0.67%), Immigrants from Austria (1.3%, a difference of 0.83%), Native Hawaiian (1.3%, a difference of 0.86%), and Maltese (1.3%, a difference of 0.93%).
| Demographics | Rating | Rank | Disability Age Under 5 |
| South American Indians | 3.3 /100 | #236 | Tragic 1.3% |
| Basques | 3.0 /100 | #237 | Tragic 1.3% |
| Spanish American Indians | 2.4 /100 | #238 | Tragic 1.3% |
| Immigrants | Austria | 2.3 /100 | #239 | Tragic 1.3% |
| Native Hawaiians | 2.2 /100 | #240 | Tragic 1.3% |
| Maltese | 2.2 /100 | #241 | Tragic 1.3% |
| Lumbee | 2.1 /100 | #242 | Tragic 1.3% |
| Immigrants | Cameroon | 1.7 /100 | #243 | Tragic 1.4% |
| Spaniards | 1.4 /100 | #244 | Tragic 1.4% |
| Potawatomi | 1.1 /100 | #245 | Tragic 1.4% |
| Russians | 1.0 /100 | #246 | Tragic 1.4% |
| Immigrants | England | 1.0 /100 | #247 | Tragic 1.4% |
| Eastern Europeans | 1.0 /100 | #248 | Tragic 1.4% |
| Bermudans | 1.0 /100 | #249 | Tragic 1.4% |
| Africans | 1.0 /100 | #250 | Tragic 1.4% |
| Immigrants | Hungary | 1.0 /100 | #251 | Tragic 1.4% |
| Immigrants | Scotland | 0.9 /100 | #252 | Tragic 1.4% |
| Australians | 0.7 /100 | #253 | Tragic 1.4% |
| Immigrants | Brazil | 0.7 /100 | #254 | Tragic 1.4% |
| Immigrants | Liberia | 0.6 /100 | #255 | Tragic 1.4% |
| Immigrants | Western Europe | 0.5 /100 | #256 | Tragic 1.4% |