Immigrants from Western Europe vs Immigrants from Taiwan Female Disability
COMPARE
Immigrants from Western Europe
Immigrants from Taiwan
Female Disability
Female Disability Comparison
Immigrants from Western Europe
Immigrants from Taiwan
12.2%
FEMALE DISABILITY
40.9/ 100
METRIC RATING
178th/ 347
METRIC RANK
10.1%
FEMALE DISABILITY
100.0/ 100
METRIC RATING
3rd/ 347
METRIC RANK
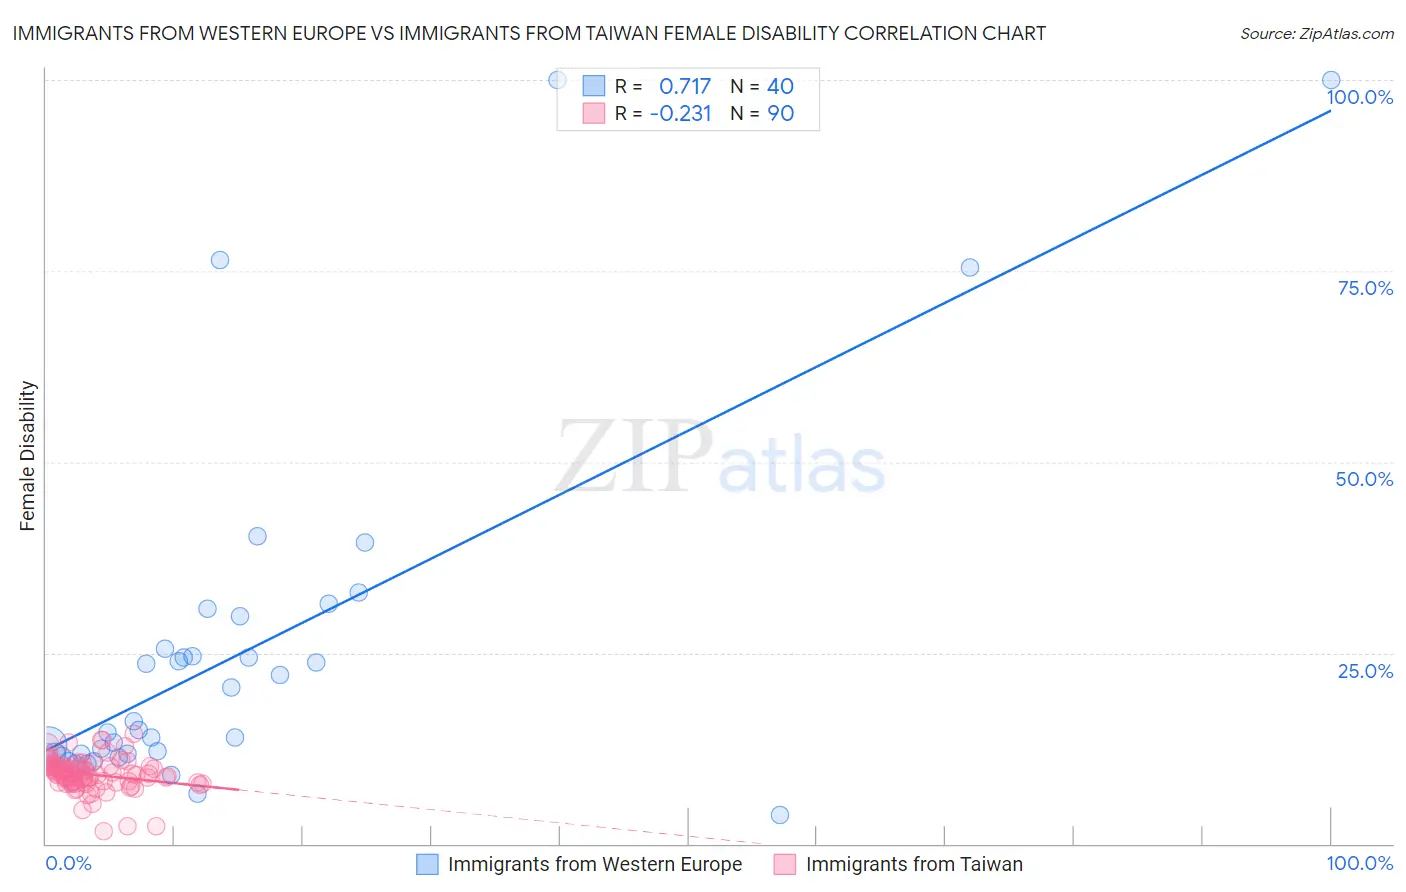
Immigrants from Western Europe vs Immigrants from Taiwan Female Disability Correlation Chart
The statistical analysis conducted on geographies consisting of 494,007,860 people shows a strong positive correlation between the proportion of Immigrants from Western Europe and percentage of females with a disability in the United States with a correlation coefficient (R) of 0.717 and weighted average of 12.2%. Similarly, the statistical analysis conducted on geographies consisting of 298,238,185 people shows a weak negative correlation between the proportion of Immigrants from Taiwan and percentage of females with a disability in the United States with a correlation coefficient (R) of -0.231 and weighted average of 10.1%, a difference of 21.3%.
Female Disability Correlation Summary
| Measurement | Immigrants from Western Europe | Immigrants from Taiwan |
| Minimum | 3.8% | 1.7% |
| Maximum | 100.0% | 14.4% |
| Range | 96.2% | 12.7% |
| Mean | 25.3% | 9.1% |
| Median | 15.5% | 9.1% |
| Interquartile 25% (IQ1) | 11.8% | 8.0% |
| Interquartile 75% (IQ3) | 27.7% | 10.1% |
| Interquartile Range (IQR) | 15.9% | 2.1% |
| Standard Deviation (Sample) | 23.2% | 2.2% |
| Standard Deviation (Population) | 22.9% | 2.2% |
Similar Demographics by Female Disability
Demographics Similar to Immigrants from Western Europe by Female Disability
In terms of female disability, the demographic groups most similar to Immigrants from Western Europe are Immigrants from Ghana (12.2%, a difference of 0.060%), Immigrants from Guyana (12.2%, a difference of 0.080%), Immigrants from Fiji (12.3%, a difference of 0.11%), Albanian (12.3%, a difference of 0.12%), and Immigrants from Canada (12.3%, a difference of 0.15%).
| Demographics | Rating | Rank | Female Disability |
| Immigrants | Southern Europe | 56.3 /100 | #171 | Average 12.2% |
| Haitians | 51.9 /100 | #172 | Average 12.2% |
| Immigrants | Mexico | 50.8 /100 | #173 | Average 12.2% |
| Immigrants | England | 50.0 /100 | #174 | Average 12.2% |
| Immigrants | St. Vincent and the Grenadines | 49.7 /100 | #175 | Average 12.2% |
| Immigrants | Guyana | 43.1 /100 | #176 | Average 12.2% |
| Immigrants | Ghana | 42.5 /100 | #177 | Average 12.2% |
| Immigrants | Western Europe | 40.9 /100 | #178 | Average 12.2% |
| Immigrants | Fiji | 38.2 /100 | #179 | Fair 12.3% |
| Albanians | 37.9 /100 | #180 | Fair 12.3% |
| Immigrants | Canada | 37.2 /100 | #181 | Fair 12.3% |
| Norwegians | 36.9 /100 | #182 | Fair 12.3% |
| Cubans | 36.5 /100 | #183 | Fair 12.3% |
| Iraqis | 36.0 /100 | #184 | Fair 12.3% |
| Immigrants | Uzbekistan | 33.9 /100 | #185 | Fair 12.3% |
Demographics Similar to Immigrants from Taiwan by Female Disability
In terms of female disability, the demographic groups most similar to Immigrants from Taiwan are Filipino (10.1%, a difference of 0.23%), Thai (10.2%, a difference of 0.88%), Immigrants from India (10.0%, a difference of 1.2%), Immigrants from Bolivia (10.3%, a difference of 1.7%), and Bolivian (10.4%, a difference of 2.6%).
| Demographics | Rating | Rank | Female Disability |
| Immigrants | India | 100.0 /100 | #1 | Exceptional 10.0% |
| Filipinos | 100.0 /100 | #2 | Exceptional 10.1% |
| Immigrants | Taiwan | 100.0 /100 | #3 | Exceptional 10.1% |
| Thais | 100.0 /100 | #4 | Exceptional 10.2% |
| Immigrants | Bolivia | 100.0 /100 | #5 | Exceptional 10.3% |
| Bolivians | 100.0 /100 | #6 | Exceptional 10.4% |
| Immigrants | Singapore | 100.0 /100 | #7 | Exceptional 10.4% |
| Immigrants | South Central Asia | 100.0 /100 | #8 | Exceptional 10.5% |
| Iranians | 100.0 /100 | #9 | Exceptional 10.6% |
| Immigrants | Hong Kong | 100.0 /100 | #10 | Exceptional 10.6% |
| Immigrants | Korea | 100.0 /100 | #11 | Exceptional 10.6% |
| Immigrants | Israel | 100.0 /100 | #12 | Exceptional 10.7% |
| Immigrants | Eastern Asia | 100.0 /100 | #13 | Exceptional 10.7% |
| Immigrants | China | 100.0 /100 | #14 | Exceptional 10.7% |
| Burmese | 100.0 /100 | #15 | Exceptional 10.7% |