Pima vs Immigrants from Taiwan Disability Age Under 5
COMPARE
Pima
Immigrants from Taiwan
Disability Age Under 5
Disability Age Under 5 Comparison
Pima
Immigrants from Taiwan
1.1%
DISABILITY AGE UNDER 5
99.8/ 100
METRIC RATING
43rd/ 347
METRIC RANK
1.0%
DISABILITY AGE UNDER 5
100.0/ 100
METRIC RATING
26th/ 347
METRIC RANK
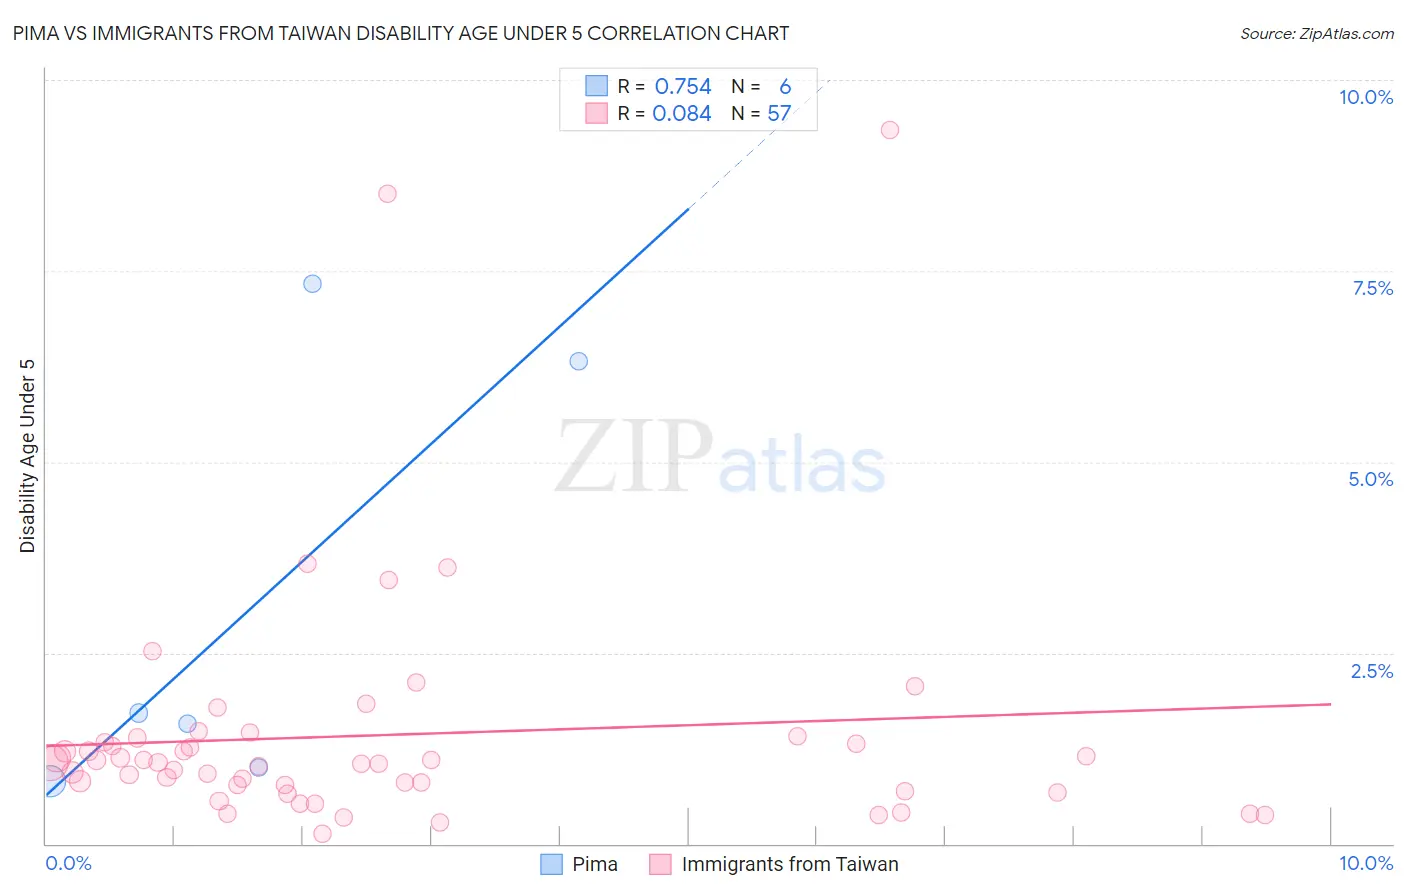
Pima vs Immigrants from Taiwan Disability Age Under 5 Correlation Chart
The statistical analysis conducted on geographies consisting of 52,697,039 people shows a strong positive correlation between the proportion of Pima and percentage of population with a disability under the age of 5 in the United States with a correlation coefficient (R) of 0.754 and weighted average of 1.1%. Similarly, the statistical analysis conducted on geographies consisting of 173,979,803 people shows a slight positive correlation between the proportion of Immigrants from Taiwan and percentage of population with a disability under the age of 5 in the United States with a correlation coefficient (R) of 0.084 and weighted average of 1.0%, a difference of 5.5%.
Disability Age Under 5 Correlation Summary
| Measurement | Pima | Immigrants from Taiwan |
| Minimum | 0.81% | 0.13% |
| Maximum | 7.3% | 9.4% |
| Range | 6.5% | 9.2% |
| Mean | 3.1% | 1.4% |
| Median | 1.6% | 1.1% |
| Interquartile 25% (IQ1) | 0.99% | 0.73% |
| Interquartile 75% (IQ3) | 6.3% | 1.4% |
| Interquartile Range (IQR) | 5.3% | 0.63% |
| Standard Deviation (Sample) | 2.9% | 1.6% |
| Standard Deviation (Population) | 2.7% | 1.6% |
Demographics Similar to Pima and Immigrants from Taiwan by Disability Age Under 5
In terms of disability age under 5, the demographic groups most similar to Pima are Immigrants from Bulgaria (1.1%, a difference of 0.010%), Immigrants from Asia (1.1%, a difference of 0.090%), Thai (1.1%, a difference of 0.11%), Immigrants from Albania (1.1%, a difference of 0.52%), and Filipino (1.1%, a difference of 0.85%). Similarly, the demographic groups most similar to Immigrants from Taiwan are Immigrants from Micronesia (1.0%, a difference of 0.12%), Indian (Asian) (1.0%, a difference of 0.43%), Guyanese (1.0%, a difference of 0.84%), Immigrants from Eastern Asia (1.0%, a difference of 1.5%), and Immigrants from Belarus (1.0%, a difference of 1.6%).
| Demographics | Rating | Rank | Disability Age Under 5 |
| Indians (Asian) | 100.0 /100 | #24 | Exceptional 1.0% |
| Immigrants | Micronesia | 100.0 /100 | #25 | Exceptional 1.0% |
| Immigrants | Taiwan | 100.0 /100 | #26 | Exceptional 1.0% |
| Guyanese | 100.0 /100 | #27 | Exceptional 1.0% |
| Immigrants | Eastern Asia | 100.0 /100 | #28 | Exceptional 1.0% |
| Immigrants | Belarus | 100.0 /100 | #29 | Exceptional 1.0% |
| Immigrants | South Central Asia | 99.9 /100 | #30 | Exceptional 1.0% |
| Armenians | 99.9 /100 | #31 | Exceptional 1.0% |
| Iranians | 99.9 /100 | #32 | Exceptional 1.0% |
| Bolivians | 99.9 /100 | #33 | Exceptional 1.0% |
| Immigrants | Ukraine | 99.9 /100 | #34 | Exceptional 1.0% |
| Barbadians | 99.9 /100 | #35 | Exceptional 1.0% |
| Immigrants | Nepal | 99.9 /100 | #36 | Exceptional 1.0% |
| Immigrants | India | 99.9 /100 | #37 | Exceptional 1.0% |
| Immigrants | Guyana | 99.9 /100 | #38 | Exceptional 1.0% |
| Filipinos | 99.9 /100 | #39 | Exceptional 1.1% |
| Immigrants | Albania | 99.9 /100 | #40 | Exceptional 1.1% |
| Thais | 99.8 /100 | #41 | Exceptional 1.1% |
| Immigrants | Bulgaria | 99.8 /100 | #42 | Exceptional 1.1% |
| Pima | 99.8 /100 | #43 | Exceptional 1.1% |
| Immigrants | Asia | 99.8 /100 | #44 | Exceptional 1.1% |