Immigrants from Western Africa vs Immigrants from Bosnia and Herzegovina Bachelor's Degree

COMPARE

Immigrants from Western Africa
Race
Ancestry
AfghanAfricanAlaska NativeAlaskan AthabascanAlbanianAleutAlsatianAmericanApacheArabArapahoArgentineanArmenianAssyrian/Chaldean/SyriacAustralianAustrianBahamianBangladeshiBarbadianBasqueBelgianBelizeanBermudanBhutaneseBlackfeetBolivianBrazilianBritishBritish West IndianBulgarianBurmeseCajunCambodianCanadianCape VerdeanCarpatho RusynCelticCentral AmericanCentral American IndianCherokeeCheyenneChickasawChileanChineseChippewaChoctawColombianColvilleComancheCosta RicanCreeCreekCroatianCrowCubanCypriotCzechCzechoslovakianDanishDelawareDominicanDutchDutch West IndianEastern EuropeanEcuadorianEgyptianEnglishEstonianEthiopianEuropeanFijianFilipinoFinnishFrenchFrench American IndianFrench CanadianGermanGerman RussianGhanaianGreekGuamanian/ChamorroGuatemalanGuyaneseHaitianHmongHonduranHopiHoumaHungarianIcelanderIndian (Asian)IndonesianInupiatIranianIraqiIrishIroquoisIsraeliItalianJamaicanJapaneseJordanianKenyanKiowaKoreanLaotianLatvianLebaneseLiberianLithuanianLumbeeLuxembourgerMacedonianMalaysianMalteseMarshalleseMenomineeMexicanMexican American IndianMongolianMoroccanNative HawaiianNavajoNepaleseNew ZealanderNicaraguanNigerianNorthern EuropeanNorwegianOkinawanOsageOttawaPaiutePakistaniPalestinianPanamanianParaguayanPennsylvania GermanPeruvianPimaPolishPortuguesePotawatomiPuebloPuerto RicanPuget Sound SalishRomanianRussianSalvadoranSamoanScandinavianScotch-IrishScottishSeminoleSenegaleseSerbianShoshoneSierra LeoneanSiouxSlavicSlovakSloveneSomaliSouth AfricanSouth AmericanSouth American IndianSoviet UnionSpaniardSpanishSpanish AmericanSpanish American IndianSri LankanSubsaharan AfricanSudaneseSwedishSwissSyrianTaiwaneseThaiTlingit-HaidaTohono O'OdhamTonganTrinidadian and TobagonianTsimshianTurkishU.S. Virgin IslanderUgandanUkrainianUruguayanUteVenezuelanVietnameseWelshWest IndianYakamaYaquiYugoslavianYumanYup'ikZimbabwean
Immigration
NonimmigrantsImmigrantsAfghanistanAfricaAlbaniaArgentinaArmeniaAsiaAustraliaAustriaBahamasBangladeshBarbadosBelarusBelgiumBelizeBoliviaBrazilBulgariaBurma/MyanmarCabo VerdeCambodiaCameroonCanadaCaribbeanCentral AmericaChileChinaColombiaCongoCosta RicaCroatiaCubaCzechoslovakiaDenmarkDominicaDominican RepublicEastern AfricaEastern AsiaEastern EuropeEcuadorEgyptEl SalvadorEnglandEritreaEthiopiaEuropeFijiFranceGermanyGhanaGreeceGrenadaGuatemalaGuyanaHaitiHondurasHong KongHungaryIndiaIndonesiaIranIraqIrelandIsraelItalyJamaicaJapanJordanKazakhstanKenyaKoreaKuwaitLaosLatin AmericaLatviaLebanonLiberiaLithuaniaMalaysiaMexicoMicronesiaMiddle AfricaMoldovaMoroccoNepalNetherlandsNicaraguaNigeriaNorth AmericaNorth MacedoniaNorthern AfricaNorthern EuropeNorwayOceaniaPakistanPanamaPeruPhilippinesPolandPortugalRomaniaRussiaSaudi ArabiaScotlandSenegalSerbiaSierra LeoneSingaporeSomaliaSouth AfricaSouth AmericaSouth Central AsiaSouth Eastern AsiaSouthern EuropeSpainSri LankaSt. Vincent and the GrenadinesSudanSwedenSwitzerlandSyriaTaiwanThailandTrinidad and TobagoTurkeyUgandaUkraineUruguayUzbekistanVenezuelaVietnamWest IndiesWestern AfricaWestern AsiaWestern EuropeYemenZaireZimbabweAzores
Immigrants from Bosnia and Herzegovina
Race
Ancestry
AfghanAfricanAlaska NativeAlaskan AthabascanAlbanianAleutAlsatianAmericanApacheArabArapahoArgentineanArmenianAssyrian/Chaldean/SyriacAustralianAustrianBahamianBangladeshiBarbadianBasqueBelgianBelizeanBermudanBhutaneseBlackfeetBolivianBrazilianBritishBritish West IndianBulgarianBurmeseCajunCambodianCanadianCape VerdeanCarpatho RusynCelticCentral AmericanCentral American IndianCherokeeCheyenneChickasawChileanChineseChippewaChoctawColombianColvilleComancheCosta RicanCreeCreekCroatianCrowCubanCypriotCzechCzechoslovakianDanishDelawareDominicanDutchDutch West IndianEastern EuropeanEcuadorianEgyptianEnglishEstonianEthiopianEuropeanFijianFilipinoFinnishFrenchFrench American IndianFrench CanadianGermanGerman RussianGhanaianGreekGuamanian/ChamorroGuatemalanGuyaneseHaitianHmongHonduranHopiHoumaHungarianIcelanderIndian (Asian)IndonesianInupiatIranianIraqiIrishIroquoisIsraeliItalianJamaicanJapaneseJordanianKenyanKiowaKoreanLaotianLatvianLebaneseLiberianLithuanianLumbeeLuxembourgerMacedonianMalaysianMalteseMarshalleseMenomineeMexicanMexican American IndianMongolianMoroccanNative HawaiianNavajoNepaleseNew ZealanderNicaraguanNigerianNorthern EuropeanNorwegianOkinawanOsageOttawaPaiutePakistaniPalestinianPanamanianParaguayanPennsylvania GermanPeruvianPimaPolishPortuguesePotawatomiPuebloPuerto RicanPuget Sound SalishRomanianRussianSalvadoranSamoanScandinavianScotch-IrishScottishSeminoleSenegaleseSerbianShoshoneSierra LeoneanSiouxSlavicSlovakSloveneSomaliSouth AfricanSouth AmericanSouth American IndianSoviet UnionSpaniardSpanishSpanish AmericanSpanish American IndianSri LankanSubsaharan AfricanSudaneseSwedishSwissSyrianTaiwaneseThaiTlingit-HaidaTohono O'OdhamTonganTrinidadian and TobagonianTsimshianTurkishU.S. Virgin IslanderUgandanUkrainianUruguayanUteVenezuelanVietnameseWelshWest IndianYakamaYaquiYugoslavianYumanYup'ikZimbabwean
Immigration
NonimmigrantsImmigrantsAfghanistanAfricaAlbaniaArgentinaArmeniaAsiaAustraliaAustriaBahamasBangladeshBarbadosBelarusBelgiumBelizeBoliviaBosnia and HerzegovinaBrazilBulgariaBurma/MyanmarCabo VerdeCambodiaCameroonCanadaCaribbeanCentral AmericaChileChinaColombiaCongoCosta RicaCroatiaCubaCzechoslovakiaDenmarkDominicaDominican RepublicEastern AfricaEastern AsiaEastern EuropeEcuadorEgyptEl SalvadorEnglandEritreaEthiopiaEuropeFijiFranceGermanyGhanaGreeceGrenadaGuatemalaGuyanaHaitiHondurasHong KongHungaryIndiaIndonesiaIranIraqIrelandIsraelItalyJamaicaJapanJordanKazakhstanKenyaKoreaKuwaitLaosLatin AmericaLatviaLebanonLiberiaLithuaniaMalaysiaMexicoMicronesiaMiddle AfricaMoldovaMoroccoNepalNetherlandsNicaraguaNigeriaNorth AmericaNorth MacedoniaNorthern AfricaNorthern EuropeNorwayOceaniaPakistanPanamaPeruPhilippinesPolandPortugalRomaniaRussiaSaudi ArabiaScotlandSenegalSerbiaSierra LeoneSingaporeSomaliaSouth AfricaSouth AmericaSouth Central AsiaSouth Eastern AsiaSouthern EuropeSpainSri LankaSt. Vincent and the GrenadinesSudanSwedenSwitzerlandSyriaTaiwanThailandTrinidad and TobagoTurkeyUgandaUkraineUruguayUzbekistanVenezuelaVietnamWest IndiesWestern AsiaWestern EuropeYemenZaireZimbabweAzores
Bachelor's Degree
Income
Poverty
Unemployment
Labor Participation
Family Structure
Vehicle Availability
Education Level
Disability

Bachelor's Degree Comparison

Immigrants from Western Africa

Immigrants from Bosnia and Herzegovina

Poor
Average
36.1%
BACHELOR'S DEGREE
13.8/ 100
METRIC RATING
215th/ 347
METRIC RANK
37.6%
BACHELOR'S DEGREE
43.4/ 100
METRIC RATING
182nd/ 347
METRIC RANK

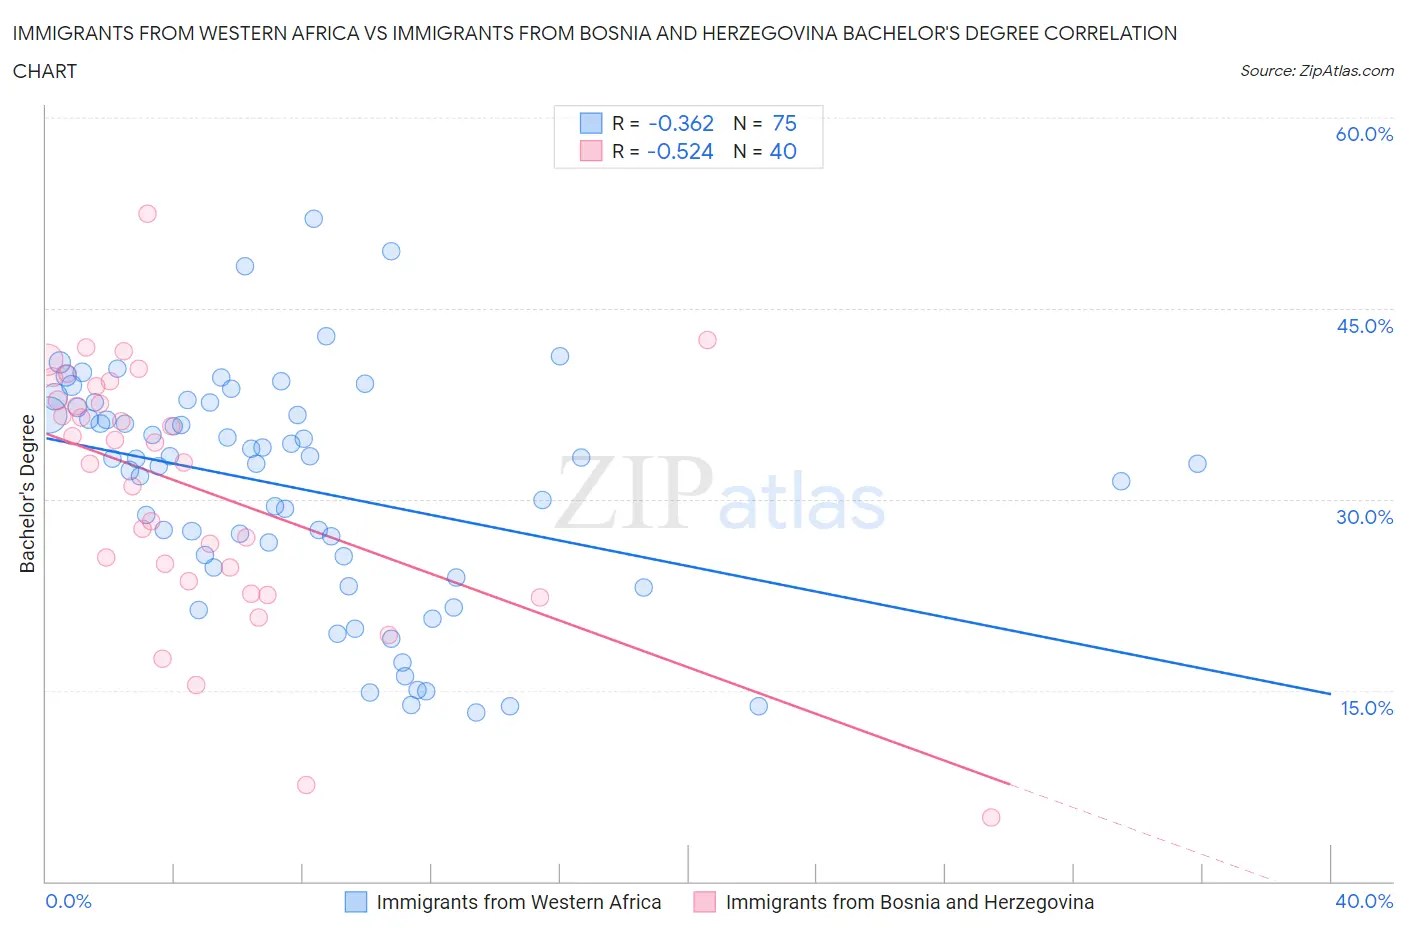
Immigrants from Western Africa vs Immigrants from Bosnia and Herzegovina Bachelor's Degree Correlation Chart

The statistical analysis conducted on geographies consisting of 357,836,949 people shows a mild negative correlation between the proportion of Immigrants from Western Africa and percentage of population with at least bachelor's degree education in the United States with a correlation coefficient (R) of -0.362 and weighted average of 36.1%. Similarly, the statistical analysis conducted on geographies consisting of 156,817,414 people shows a substantial negative correlation between the proportion of Immigrants from Bosnia and Herzegovina and percentage of population with at least bachelor's degree education in the United States with a correlation coefficient (R) of -0.524 and weighted average of 37.6%, a difference of 4.0%.
Immigrants from Western Africa vs Immigrants from Bosnia and Herzegovina Bachelor's Degree

Bachelor's Degree Correlation Summary

MeasurementImmigrants from Western AfricaImmigrants from Bosnia and Herzegovina
Minimum13.3%5.0%
Maximum52.0%52.4%
Range38.8%47.4%
Mean30.9%30.9%
Median33.2%33.7%
Interquartile 25% (IQ1)24.6%24.1%
Interquartile 75% (IQ3)37.3%38.3%
Interquartile Range (IQR)12.6%14.2%
Standard Deviation (Sample)9.0%10.0%
Standard Deviation (Population)8.9%9.9%

Similar Demographics by Bachelor's Degree

Demographics Similar to Immigrants from Western Africa by Bachelor's Degree

In terms of bachelor's degree, the demographic groups most similar to Immigrants from Western Africa are German (36.1%, a difference of 0.030%), Barbadian (36.1%, a difference of 0.060%), Immigrants from Panama (36.2%, a difference of 0.10%), Immigrants from Philippines (36.4%, a difference of 0.78%), and Scotch-Irish (36.4%, a difference of 0.86%).
DemographicsRating | RankBachelor's Degree
Immigrants | Thailand
19.4
/100
|
#208
Poor
36.5%
Panamanians
18.8
/100
|
#209
Poor
36.5%
French
18.6
/100
|
#210
Poor
36.5%
Scotch-Irish
18.3
/100
|
#211
Poor
36.4%
Immigrants | Philippines
17.8
/100
|
#212
Poor
36.4%
Immigrants | Panama
14.2
/100
|
#213
Poor
36.2%
Germans
13.9
/100
|
#214
Poor
36.1%
Immigrants | Western Africa
13.8
/100
|
#215
Poor
36.1%
Barbadians
13.5
/100
|
#216
Poor
36.1%
German Russians
10.2
/100
|
#217
Poor
35.8%
Sub-Saharan Africans
9.8
/100
|
#218
Tragic
35.8%
West Indians
9.7
/100
|
#219
Tragic
35.8%
Spanish
9.6
/100
|
#220
Tragic
35.8%
Dutch
9.2
/100
|
#221
Tragic
35.7%
Trinidadians and Tobagonians
8.8
/100
|
#222
Tragic
35.7%

Demographics Similar to Immigrants from Bosnia and Herzegovina by Bachelor's Degree

In terms of bachelor's degree, the demographic groups most similar to Immigrants from Bosnia and Herzegovina are Immigrants from Senegal (37.6%, a difference of 0.030%), Irish (37.6%, a difference of 0.090%), Senegalese (37.5%, a difference of 0.13%), Scandinavian (37.5%, a difference of 0.17%), and Immigrants from Colombia (37.7%, a difference of 0.20%).
DemographicsRating | RankBachelor's Degree
Immigrants | Uruguay
48.3
/100
|
#175
Average
37.8%
Costa Ricans
47.6
/100
|
#176
Average
37.7%
Basques
47.4
/100
|
#177
Average
37.7%
Immigrants | Cameroon
46.8
/100
|
#178
Average
37.7%
Immigrants | Colombia
45.4
/100
|
#179
Average
37.7%
Irish
44.3
/100
|
#180
Average
37.6%
Immigrants | Senegal
43.8
/100
|
#181
Average
37.6%
Immigrants | Bosnia and Herzegovina
43.4
/100
|
#182
Average
37.6%
Senegalese
42.2
/100
|
#183
Average
37.5%
Scandinavians
41.7
/100
|
#184
Average
37.5%
Immigrants | Peru
41.3
/100
|
#185
Average
37.5%
Norwegians
40.4
/100
|
#186
Average
37.5%
English
39.7
/100
|
#187
Fair
37.4%
Immigrants | Oceania
37.3
/100
|
#188
Fair
37.3%
Slovaks
36.9
/100
|
#189
Fair
37.3%