Immigrants from West Indies vs Central American Male Disability
COMPARE
Immigrants from West Indies
Central American
Male Disability
Male Disability Comparison
Immigrants from West Indies
Central Americans
11.1%
MALE DISABILITY
65.7/ 100
METRIC RATING
161st/ 347
METRIC RANK
10.8%
MALE DISABILITY
92.7/ 100
METRIC RATING
114th/ 347
METRIC RANK
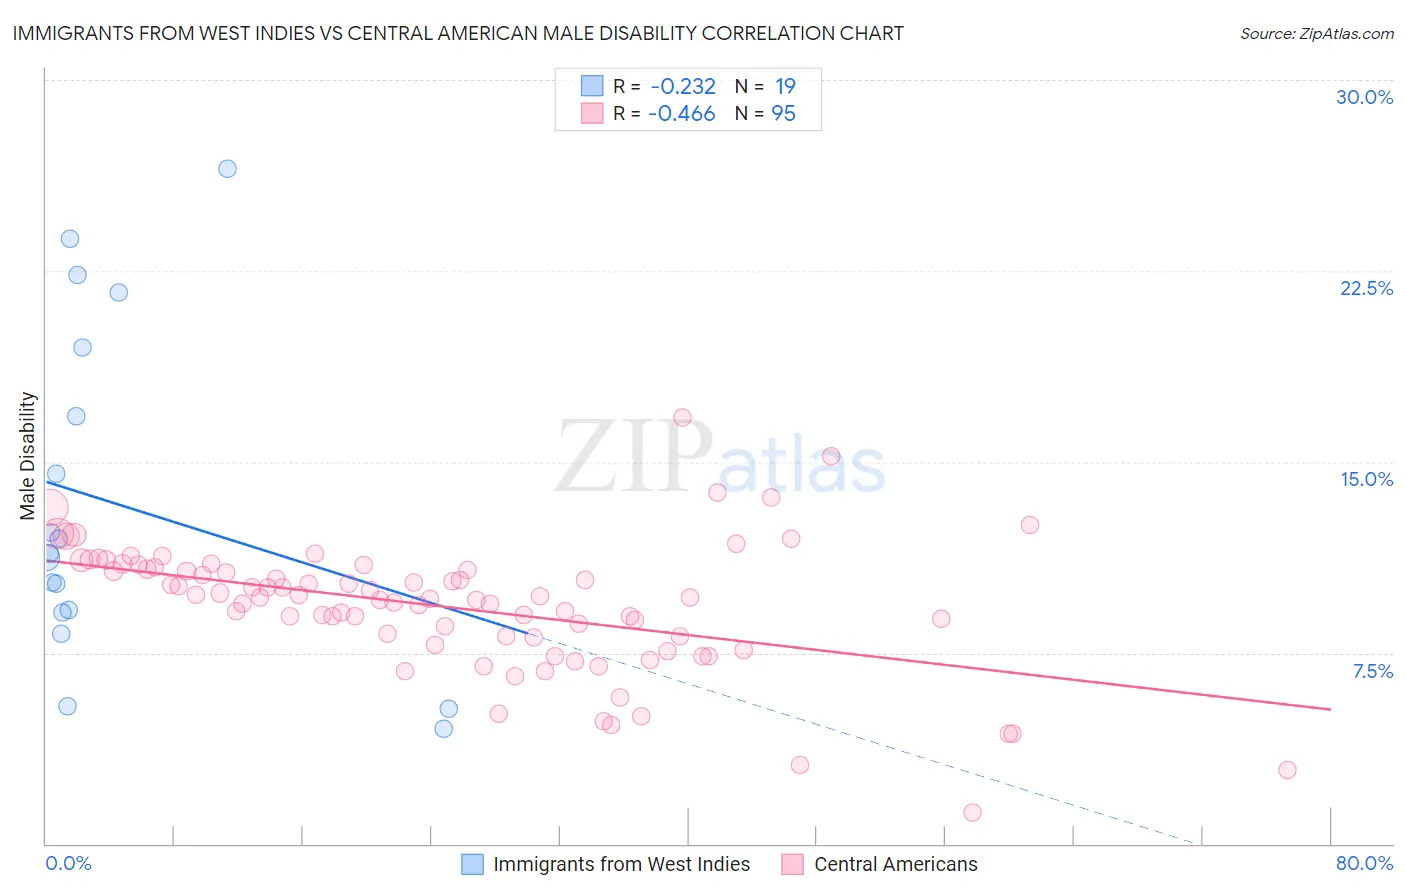
Immigrants from West Indies vs Central American Male Disability Correlation Chart
The statistical analysis conducted on geographies consisting of 72,456,461 people shows a weak negative correlation between the proportion of Immigrants from West Indies and percentage of males with a disability in the United States with a correlation coefficient (R) of -0.232 and weighted average of 11.1%. Similarly, the statistical analysis conducted on geographies consisting of 504,432,725 people shows a moderate negative correlation between the proportion of Central Americans and percentage of males with a disability in the United States with a correlation coefficient (R) of -0.466 and weighted average of 10.8%, a difference of 2.7%.
Male Disability Correlation Summary
| Measurement | Immigrants from West Indies | Central American |
| Minimum | 4.5% | 1.3% |
| Maximum | 26.5% | 16.7% |
| Range | 22.0% | 15.5% |
| Mean | 13.4% | 9.3% |
| Median | 11.4% | 9.7% |
| Interquartile 25% (IQ1) | 9.1% | 8.1% |
| Interquartile 75% (IQ3) | 19.5% | 10.8% |
| Interquartile Range (IQR) | 10.4% | 2.7% |
| Standard Deviation (Sample) | 6.6% | 2.5% |
| Standard Deviation (Population) | 6.4% | 2.5% |
Similar Demographics by Male Disability
Demographics Similar to Immigrants from West Indies by Male Disability
In terms of male disability, the demographic groups most similar to Immigrants from West Indies are Immigrants from Haiti (11.1%, a difference of 0.020%), Albanian (11.1%, a difference of 0.050%), Guatemalan (11.1%, a difference of 0.090%), Immigrants from Kenya (11.1%, a difference of 0.12%), and Latvian (11.1%, a difference of 0.16%).
| Demographics | Rating | Rank | Male Disability |
| Immigrants | Moldova | 72.8 /100 | #154 | Good 11.1% |
| Immigrants | Middle Africa | 70.9 /100 | #155 | Good 11.1% |
| Russians | 69.8 /100 | #156 | Good 11.1% |
| Immigrants | Western Africa | 69.2 /100 | #157 | Good 11.1% |
| Latvians | 68.1 /100 | #158 | Good 11.1% |
| Guatemalans | 67.2 /100 | #159 | Good 11.1% |
| Albanians | 66.5 /100 | #160 | Good 11.1% |
| Immigrants | West Indies | 65.7 /100 | #161 | Good 11.1% |
| Immigrants | Haiti | 65.3 /100 | #162 | Good 11.1% |
| Immigrants | Kenya | 63.8 /100 | #163 | Good 11.1% |
| British West Indians | 62.8 /100 | #164 | Good 11.1% |
| Luxembourgers | 61.9 /100 | #165 | Good 11.1% |
| Immigrants | Hungary | 61.2 /100 | #166 | Good 11.1% |
| Immigrants | Southern Europe | 54.4 /100 | #167 | Average 11.2% |
| Immigrants | Latin America | 54.0 /100 | #168 | Average 11.2% |
Demographics Similar to Central Americans by Male Disability
In terms of male disability, the demographic groups most similar to Central Americans are Immigrants from Zimbabwe (10.8%, a difference of 0.070%), Immigrants from Barbados (10.8%, a difference of 0.10%), Ghanaian (10.8%, a difference of 0.15%), Immigrants from South Africa (10.8%, a difference of 0.17%), and Immigrants from Uruguay (10.8%, a difference of 0.25%).
| Demographics | Rating | Rank | Male Disability |
| Immigrants | Eastern Africa | 94.3 /100 | #107 | Exceptional 10.8% |
| Immigrants | Belgium | 94.2 /100 | #108 | Exceptional 10.8% |
| Immigrants | Uganda | 94.0 /100 | #109 | Exceptional 10.8% |
| Immigrants | Immigrants | 93.9 /100 | #110 | Exceptional 10.8% |
| Immigrants | Uruguay | 93.8 /100 | #111 | Exceptional 10.8% |
| Ghanaians | 93.4 /100 | #112 | Exceptional 10.8% |
| Immigrants | Zimbabwe | 93.0 /100 | #113 | Exceptional 10.8% |
| Central Americans | 92.7 /100 | #114 | Exceptional 10.8% |
| Immigrants | Barbados | 92.2 /100 | #115 | Exceptional 10.8% |
| Immigrants | South Africa | 91.8 /100 | #116 | Exceptional 10.8% |
| Eastern Europeans | 90.6 /100 | #117 | Exceptional 10.9% |
| Immigrants | Cuba | 90.2 /100 | #118 | Exceptional 10.9% |
| Armenians | 90.1 /100 | #119 | Exceptional 10.9% |
| Immigrants | Africa | 89.4 /100 | #120 | Excellent 10.9% |
| Immigrants | South Eastern Asia | 89.2 /100 | #121 | Excellent 10.9% |