Immigrants from West Indies vs Immigrants from Morocco Disability Age 65 to 74

COMPARE

Immigrants from West Indies
Race
Ancestry
AfghanAfricanAlaska NativeAlaskan AthabascanAlbanianAleutAlsatianAmericanApacheArabArapahoArgentineanArmenianAssyrian/Chaldean/SyriacAustralianAustrianBahamianBangladeshiBarbadianBasqueBelgianBelizeanBermudanBhutaneseBlackfeetBolivianBrazilianBritishBritish West IndianBulgarianBurmeseCajunCambodianCanadianCape VerdeanCarpatho RusynCelticCentral AmericanCentral American IndianCherokeeCheyenneChickasawChileanChineseChippewaChoctawColombianColvilleComancheCosta RicanCreeCreekCroatianCrowCubanCypriotCzechCzechoslovakianDanishDelawareDominicanDutchDutch West IndianEastern EuropeanEcuadorianEgyptianEnglishEstonianEthiopianEuropeanFijianFilipinoFinnishFrenchFrench American IndianFrench CanadianGermanGerman RussianGhanaianGreekGuamanian/ChamorroGuatemalanGuyaneseHaitianHmongHonduranHopiHoumaHungarianIcelanderIndian (Asian)IndonesianInupiatIranianIraqiIrishIroquoisIsraeliItalianJamaicanJapaneseJordanianKenyanKiowaKoreanLaotianLatvianLebaneseLiberianLithuanianLumbeeLuxembourgerMacedonianMalaysianMalteseMarshalleseMenomineeMexicanMexican American IndianMongolianMoroccanNative HawaiianNavajoNepaleseNew ZealanderNicaraguanNigerianNorthern EuropeanNorwegianOkinawanOsageOttawaPaiutePakistaniPalestinianPanamanianParaguayanPennsylvania GermanPeruvianPimaPolishPortuguesePotawatomiPuebloPuerto RicanPuget Sound SalishRomanianRussianSalvadoranSamoanScandinavianScotch-IrishScottishSeminoleSenegaleseSerbianShoshoneSierra LeoneanSiouxSlavicSlovakSloveneSomaliSouth AfricanSouth AmericanSouth American IndianSoviet UnionSpaniardSpanishSpanish AmericanSpanish American IndianSri LankanSubsaharan AfricanSudaneseSwedishSwissSyrianTaiwaneseThaiTlingit-HaidaTohono O'OdhamTonganTrinidadian and TobagonianTsimshianTurkishU.S. Virgin IslanderUgandanUkrainianUruguayanUteVenezuelanVietnameseWelshWest IndianYakamaYaquiYugoslavianYumanYup'ikZimbabwean
Immigration
NonimmigrantsImmigrantsAfghanistanAfricaAlbaniaArgentinaArmeniaAsiaAustraliaAustriaBahamasBangladeshBarbadosBelarusBelgiumBelizeBoliviaBosnia and HerzegovinaBrazilBulgariaBurma/MyanmarCabo VerdeCambodiaCameroonCanadaCaribbeanCentral AmericaChileChinaColombiaCongoCosta RicaCroatiaCubaCzechoslovakiaDenmarkDominicaDominican RepublicEastern AfricaEastern AsiaEastern EuropeEcuadorEgyptEl SalvadorEnglandEritreaEthiopiaEuropeFijiFranceGermanyGhanaGreeceGrenadaGuatemalaGuyanaHaitiHondurasHong KongHungaryIndiaIndonesiaIranIraqIrelandIsraelItalyJamaicaJapanJordanKazakhstanKenyaKoreaKuwaitLaosLatin AmericaLatviaLebanonLiberiaLithuaniaMalaysiaMexicoMicronesiaMiddle AfricaMoldovaNepalNetherlandsNicaraguaNigeriaNorth AmericaNorth MacedoniaNorthern AfricaNorthern EuropeNorwayOceaniaPakistanPanamaPeruPhilippinesPolandPortugalRomaniaRussiaSaudi ArabiaScotlandSenegalSerbiaSierra LeoneSingaporeSomaliaSouth AfricaSouth AmericaSouth Central AsiaSouth Eastern AsiaSouthern EuropeSpainSri LankaSt. Vincent and the GrenadinesSudanSwedenSwitzerlandSyriaTaiwanThailandTrinidad and TobagoTurkeyUgandaUkraineUruguayUzbekistanVenezuelaVietnamWest IndiesWestern AfricaWestern AsiaWestern EuropeYemenZaireZimbabweAzores
Immigrants from Morocco
Race
Ancestry
AfghanAfricanAlaska NativeAlaskan AthabascanAlbanianAleutAlsatianAmericanApacheArabArapahoArgentineanArmenianAssyrian/Chaldean/SyriacAustralianAustrianBahamianBangladeshiBarbadianBasqueBelgianBelizeanBermudanBhutaneseBlackfeetBolivianBrazilianBritishBritish West IndianBulgarianBurmeseCajunCambodianCanadianCape VerdeanCarpatho RusynCelticCentral AmericanCentral American IndianCherokeeCheyenneChickasawChileanChineseChippewaChoctawColombianColvilleComancheCosta RicanCreeCreekCroatianCrowCubanCypriotCzechCzechoslovakianDanishDelawareDominicanDutchDutch West IndianEastern EuropeanEcuadorianEgyptianEnglishEstonianEthiopianEuropeanFijianFilipinoFinnishFrenchFrench American IndianFrench CanadianGermanGerman RussianGhanaianGreekGuamanian/ChamorroGuatemalanGuyaneseHaitianHmongHonduranHopiHoumaHungarianIcelanderIndian (Asian)IndonesianInupiatIranianIraqiIrishIroquoisIsraeliItalianJamaicanJapaneseJordanianKenyanKiowaKoreanLaotianLatvianLebaneseLiberianLithuanianLumbeeLuxembourgerMacedonianMalaysianMalteseMarshalleseMenomineeMexicanMexican American IndianMongolianMoroccanNative HawaiianNavajoNepaleseNew ZealanderNicaraguanNigerianNorthern EuropeanNorwegianOkinawanOsageOttawaPaiutePakistaniPalestinianPanamanianParaguayanPennsylvania GermanPeruvianPimaPolishPortuguesePotawatomiPuebloPuerto RicanPuget Sound SalishRomanianRussianSalvadoranSamoanScandinavianScotch-IrishScottishSeminoleSenegaleseSerbianShoshoneSierra LeoneanSiouxSlavicSlovakSloveneSomaliSouth AfricanSouth AmericanSouth American IndianSoviet UnionSpaniardSpanishSpanish AmericanSpanish American IndianSri LankanSubsaharan AfricanSudaneseSwedishSwissSyrianTaiwaneseThaiTlingit-HaidaTohono O'OdhamTonganTrinidadian and TobagonianTsimshianTurkishU.S. Virgin IslanderUgandanUkrainianUruguayanUteVenezuelanVietnameseWelshWest IndianYakamaYaquiYugoslavianYumanYup'ikZimbabwean
Immigration
NonimmigrantsImmigrantsAfghanistanAfricaAlbaniaArgentinaArmeniaAsiaAustraliaAustriaBahamasBangladeshBarbadosBelarusBelgiumBelizeBoliviaBosnia and HerzegovinaBrazilBulgariaBurma/MyanmarCabo VerdeCambodiaCameroonCanadaCaribbeanCentral AmericaChileChinaColombiaCongoCosta RicaCroatiaCubaCzechoslovakiaDenmarkDominicaDominican RepublicEastern AfricaEastern AsiaEastern EuropeEcuadorEgyptEl SalvadorEnglandEritreaEthiopiaEuropeFijiFranceGermanyGhanaGreeceGrenadaGuatemalaGuyanaHaitiHondurasHong KongHungaryIndiaIndonesiaIranIraqIrelandIsraelItalyJamaicaJapanJordanKazakhstanKenyaKoreaKuwaitLaosLatin AmericaLatviaLebanonLiberiaLithuaniaMalaysiaMexicoMicronesiaMiddle AfricaMoldovaMoroccoNepalNetherlandsNicaraguaNigeriaNorth AmericaNorth MacedoniaNorthern AfricaNorthern EuropeNorwayOceaniaPakistanPanamaPeruPhilippinesPolandPortugalRomaniaRussiaSaudi ArabiaScotlandSenegalSerbiaSierra LeoneSingaporeSomaliaSouth AfricaSouth AmericaSouth Central AsiaSouth Eastern AsiaSouthern EuropeSpainSri LankaSt. Vincent and the GrenadinesSudanSwedenSwitzerlandSyriaTaiwanThailandTrinidad and TobagoTurkeyUgandaUkraineUruguayUzbekistanVenezuelaVietnamWestern AfricaWestern AsiaWestern EuropeYemenZaireZimbabweAzores
Disability Age 65 to 74
Income
Poverty
Unemployment
Labor Participation
Family Structure
Vehicle Availability
Education Level
Disability

Disability Age 65 to 74 Comparison

Immigrants from West Indies

Immigrants from Morocco

Poor
Good
23.9%
DISABILITY AGE 65 TO 74
15.9/ 100
METRIC RATING
211th/ 347
METRIC RANK
22.9%
DISABILITY AGE 65 TO 74
77.6/ 100
METRIC RATING
151st/ 347
METRIC RANK

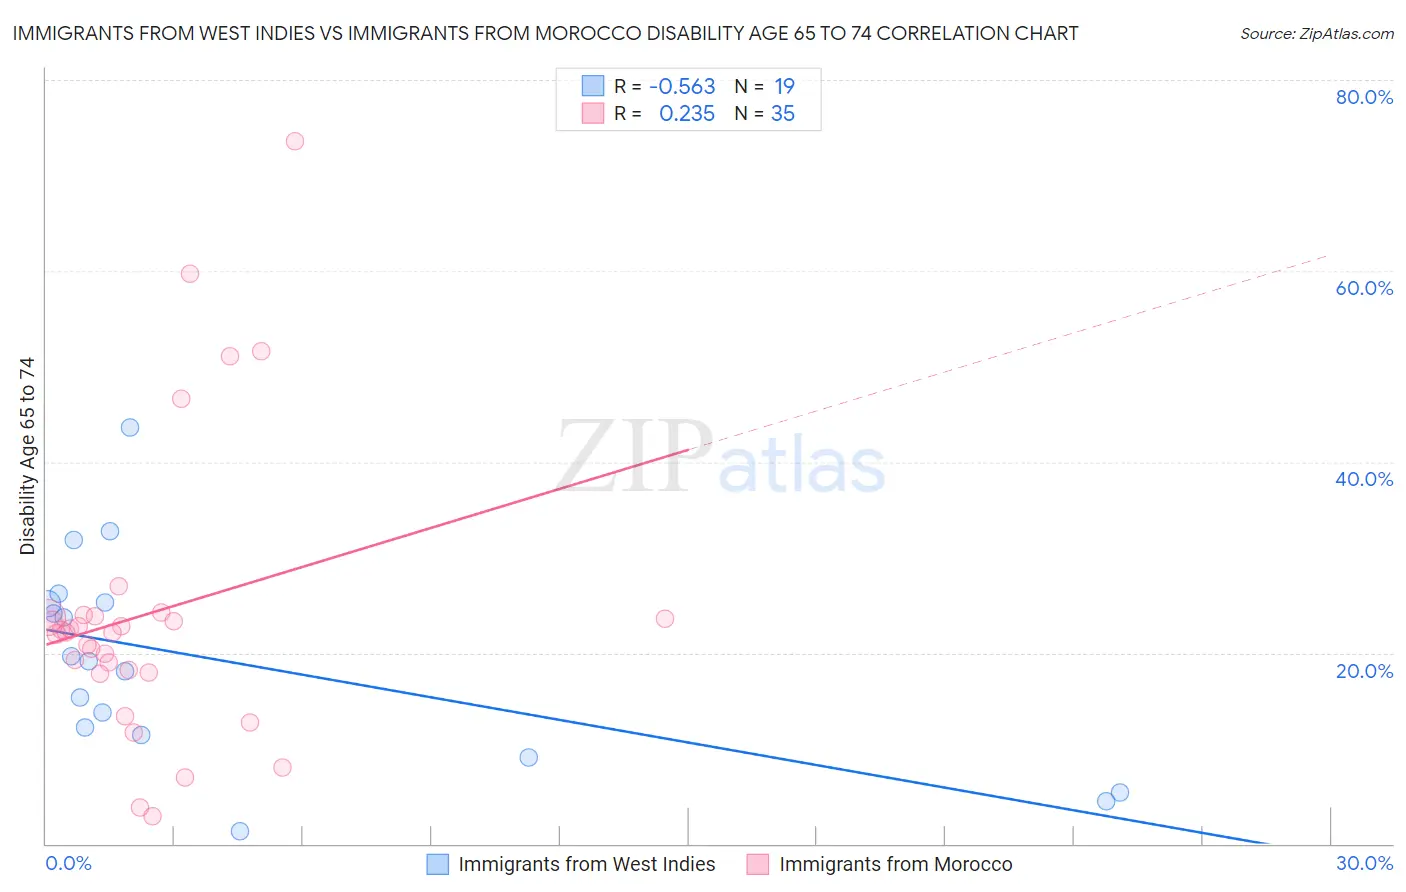
Immigrants from West Indies vs Immigrants from Morocco Disability Age 65 to 74 Correlation Chart

The statistical analysis conducted on geographies consisting of 72,453,318 people shows a substantial negative correlation between the proportion of Immigrants from West Indies and percentage of population with a disability between the ages 65 and 75 in the United States with a correlation coefficient (R) of -0.563 and weighted average of 23.9%. Similarly, the statistical analysis conducted on geographies consisting of 178,856,303 people shows a weak positive correlation between the proportion of Immigrants from Morocco and percentage of population with a disability between the ages 65 and 75 in the United States with a correlation coefficient (R) of 0.235 and weighted average of 22.9%, a difference of 4.3%.
Immigrants from West Indies vs Immigrants from Morocco Disability Age 65 to 74

Disability Age 65 to 74 Correlation Summary

MeasurementImmigrants from West IndiesImmigrants from Morocco
Minimum1.3%2.9%
Maximum43.6%73.6%
Range42.3%70.7%
Mean19.1%24.1%
Median19.1%22.1%
Interquartile 25% (IQ1)11.4%17.9%
Interquartile 75% (IQ3)25.2%23.9%
Interquartile Range (IQR)13.9%6.0%
Standard Deviation (Sample)10.8%15.1%
Standard Deviation (Population)10.5%14.9%

Similar Demographics by Disability Age 65 to 74

Demographics Similar to Immigrants from West Indies by Disability Age 65 to 74

In terms of disability age 65 to 74, the demographic groups most similar to Immigrants from West Indies are French (23.9%, a difference of 0.020%), Trinidadian and Tobagonian (23.9%, a difference of 0.050%), Nicaraguan (23.9%, a difference of 0.19%), Immigrants from Oceania (24.0%, a difference of 0.26%), and Pennsylvania German (24.0%, a difference of 0.31%).
DemographicsRating | RankDisability Age 65 to 74
Immigrants | Grenada
22.1
/100
|
#204
Fair
23.8%
Tongans
20.8
/100
|
#205
Fair
23.8%
Immigrants | Jamaica
20.7
/100
|
#206
Fair
23.8%
Immigrants | Sudan
20.1
/100
|
#207
Fair
23.8%
Immigrants | Barbados
19.6
/100
|
#208
Poor
23.8%
Immigrants | Kenya
19.6
/100
|
#209
Poor
23.8%
Trinidadians and Tobagonians
16.4
/100
|
#210
Poor
23.9%
Immigrants | West Indies
15.9
/100
|
#211
Poor
23.9%
French
15.7
/100
|
#212
Poor
23.9%
Nicaraguans
14.3
/100
|
#213
Poor
23.9%
Immigrants | Oceania
13.6
/100
|
#214
Poor
24.0%
Pennsylvania Germans
13.3
/100
|
#215
Poor
24.0%
Jamaicans
12.2
/100
|
#216
Poor
24.0%
Immigrants | Portugal
11.7
/100
|
#217
Poor
24.0%
Immigrants | Nigeria
11.7
/100
|
#218
Poor
24.0%

Demographics Similar to Immigrants from Morocco by Disability Age 65 to 74

In terms of disability age 65 to 74, the demographic groups most similar to Immigrants from Morocco are Canadian (22.9%, a difference of 0.0%), Finnish (22.9%, a difference of 0.090%), Swiss (22.9%, a difference of 0.18%), New Zealander (22.9%, a difference of 0.20%), and Slavic (23.0%, a difference of 0.20%).
DemographicsRating | RankDisability Age 65 to 74
Danes
84.4
/100
|
#144
Excellent
22.8%
Immigrants | Uganda
84.0
/100
|
#145
Excellent
22.8%
Alsatians
83.7
/100
|
#146
Excellent
22.8%
Immigrants | Uzbekistan
83.1
/100
|
#147
Excellent
22.8%
New Zealanders
79.9
/100
|
#148
Good
22.9%
Swiss
79.7
/100
|
#149
Good
22.9%
Canadians
77.7
/100
|
#150
Good
22.9%
Immigrants | Morocco
77.6
/100
|
#151
Good
22.9%
Finns
76.5
/100
|
#152
Good
22.9%
Slavs
75.2
/100
|
#153
Good
23.0%
Sri Lankans
74.0
/100
|
#154
Good
23.0%
British
73.9
/100
|
#155
Good
23.0%
Immigrants | Western Asia
73.8
/100
|
#156
Good
23.0%
Czechoslovakians
72.4
/100
|
#157
Good
23.0%
Immigrants | Vietnam
69.1
/100
|
#158
Good
23.1%