Immigrants from West Indies vs Scotch-Irish Disability Age 65 to 74
COMPARE
Immigrants from West Indies
Scotch-Irish
Disability Age 65 to 74
Disability Age 65 to 74 Comparison
Immigrants from West Indies
Scotch-Irish
23.9%
DISABILITY AGE 65 TO 74
15.9/ 100
METRIC RATING
211th/ 347
METRIC RANK
24.4%
DISABILITY AGE 65 TO 74
3.8/ 100
METRIC RATING
235th/ 347
METRIC RANK
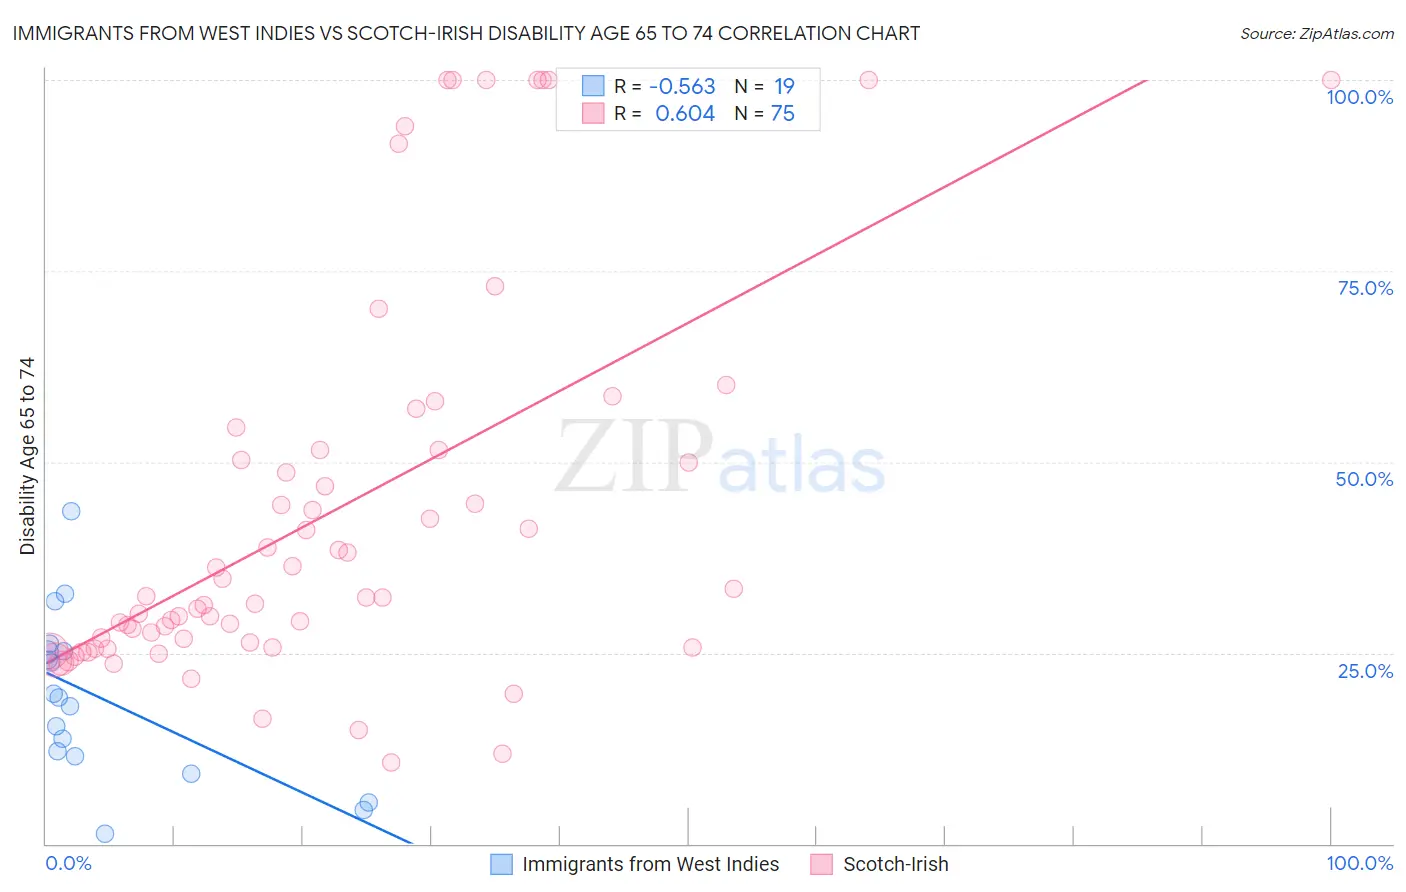
Immigrants from West Indies vs Scotch-Irish Disability Age 65 to 74 Correlation Chart
The statistical analysis conducted on geographies consisting of 72,453,318 people shows a substantial negative correlation between the proportion of Immigrants from West Indies and percentage of population with a disability between the ages 65 and 75 in the United States with a correlation coefficient (R) of -0.563 and weighted average of 23.9%. Similarly, the statistical analysis conducted on geographies consisting of 546,992,221 people shows a significant positive correlation between the proportion of Scotch-Irish and percentage of population with a disability between the ages 65 and 75 in the United States with a correlation coefficient (R) of 0.604 and weighted average of 24.4%, a difference of 2.2%.
Disability Age 65 to 74 Correlation Summary
| Measurement | Immigrants from West Indies | Scotch-Irish |
| Minimum | 1.3% | 10.7% |
| Maximum | 43.6% | 100.0% |
| Range | 42.3% | 89.3% |
| Mean | 19.1% | 43.1% |
| Median | 19.1% | 32.3% |
| Interquartile 25% (IQ1) | 11.4% | 25.8% |
| Interquartile 75% (IQ3) | 25.2% | 51.5% |
| Interquartile Range (IQR) | 13.9% | 25.7% |
| Standard Deviation (Sample) | 10.8% | 25.2% |
| Standard Deviation (Population) | 10.5% | 25.0% |
Similar Demographics by Disability Age 65 to 74
Demographics Similar to Immigrants from West Indies by Disability Age 65 to 74
In terms of disability age 65 to 74, the demographic groups most similar to Immigrants from West Indies are French (23.9%, a difference of 0.020%), Trinidadian and Tobagonian (23.9%, a difference of 0.050%), Nicaraguan (23.9%, a difference of 0.19%), Immigrants from Oceania (24.0%, a difference of 0.26%), and Pennsylvania German (24.0%, a difference of 0.31%).
| Demographics | Rating | Rank | Disability Age 65 to 74 |
| Immigrants | Grenada | 22.1 /100 | #204 | Fair 23.8% |
| Tongans | 20.8 /100 | #205 | Fair 23.8% |
| Immigrants | Jamaica | 20.7 /100 | #206 | Fair 23.8% |
| Immigrants | Sudan | 20.1 /100 | #207 | Fair 23.8% |
| Immigrants | Barbados | 19.6 /100 | #208 | Poor 23.8% |
| Immigrants | Kenya | 19.6 /100 | #209 | Poor 23.8% |
| Trinidadians and Tobagonians | 16.4 /100 | #210 | Poor 23.9% |
| Immigrants | West Indies | 15.9 /100 | #211 | Poor 23.9% |
| French | 15.7 /100 | #212 | Poor 23.9% |
| Nicaraguans | 14.3 /100 | #213 | Poor 23.9% |
| Immigrants | Oceania | 13.6 /100 | #214 | Poor 24.0% |
| Pennsylvania Germans | 13.3 /100 | #215 | Poor 24.0% |
| Jamaicans | 12.2 /100 | #216 | Poor 24.0% |
| Immigrants | Portugal | 11.7 /100 | #217 | Poor 24.0% |
| Immigrants | Nigeria | 11.7 /100 | #218 | Poor 24.0% |
Demographics Similar to Scotch-Irish by Disability Age 65 to 74
In terms of disability age 65 to 74, the demographic groups most similar to Scotch-Irish are German Russian (24.4%, a difference of 0.040%), West Indian (24.5%, a difference of 0.14%), Panamanian (24.4%, a difference of 0.16%), Bahamian (24.4%, a difference of 0.26%), and Immigrants from Ghana (24.5%, a difference of 0.31%).
| Demographics | Rating | Rank | Disability Age 65 to 74 |
| Whites/Caucasians | 6.6 /100 | #228 | Tragic 24.2% |
| Celtics | 6.4 /100 | #229 | Tragic 24.2% |
| Barbadians | 6.0 /100 | #230 | Tragic 24.3% |
| Immigrants | Thailand | 5.2 /100 | #231 | Tragic 24.3% |
| Immigrants | Zaire | 5.0 /100 | #232 | Tragic 24.3% |
| Bahamians | 4.5 /100 | #233 | Tragic 24.4% |
| Panamanians | 4.2 /100 | #234 | Tragic 24.4% |
| Scotch-Irish | 3.8 /100 | #235 | Tragic 24.4% |
| German Russians | 3.7 /100 | #236 | Tragic 24.4% |
| West Indians | 3.4 /100 | #237 | Tragic 24.5% |
| Immigrants | Ghana | 3.0 /100 | #238 | Tragic 24.5% |
| Immigrants | Caribbean | 2.6 /100 | #239 | Tragic 24.6% |
| Spaniards | 2.4 /100 | #240 | Tragic 24.6% |
| Immigrants | Western Africa | 2.3 /100 | #241 | Tragic 24.6% |
| Immigrants | Senegal | 2.2 /100 | #242 | Tragic 24.6% |