Immigrants from West Indies vs Central American 12th Grade, No Diploma
COMPARE
Immigrants from West Indies
Central American
12th Grade, No Diploma
12th Grade, No Diploma Comparison
Immigrants from West Indies
Central Americans
88.6%
12TH GRADE, NO DIPLOMA
0.0/ 100
METRIC RATING
286th/ 347
METRIC RANK
85.2%
12TH GRADE, NO DIPLOMA
0.0/ 100
METRIC RATING
331st/ 347
METRIC RANK
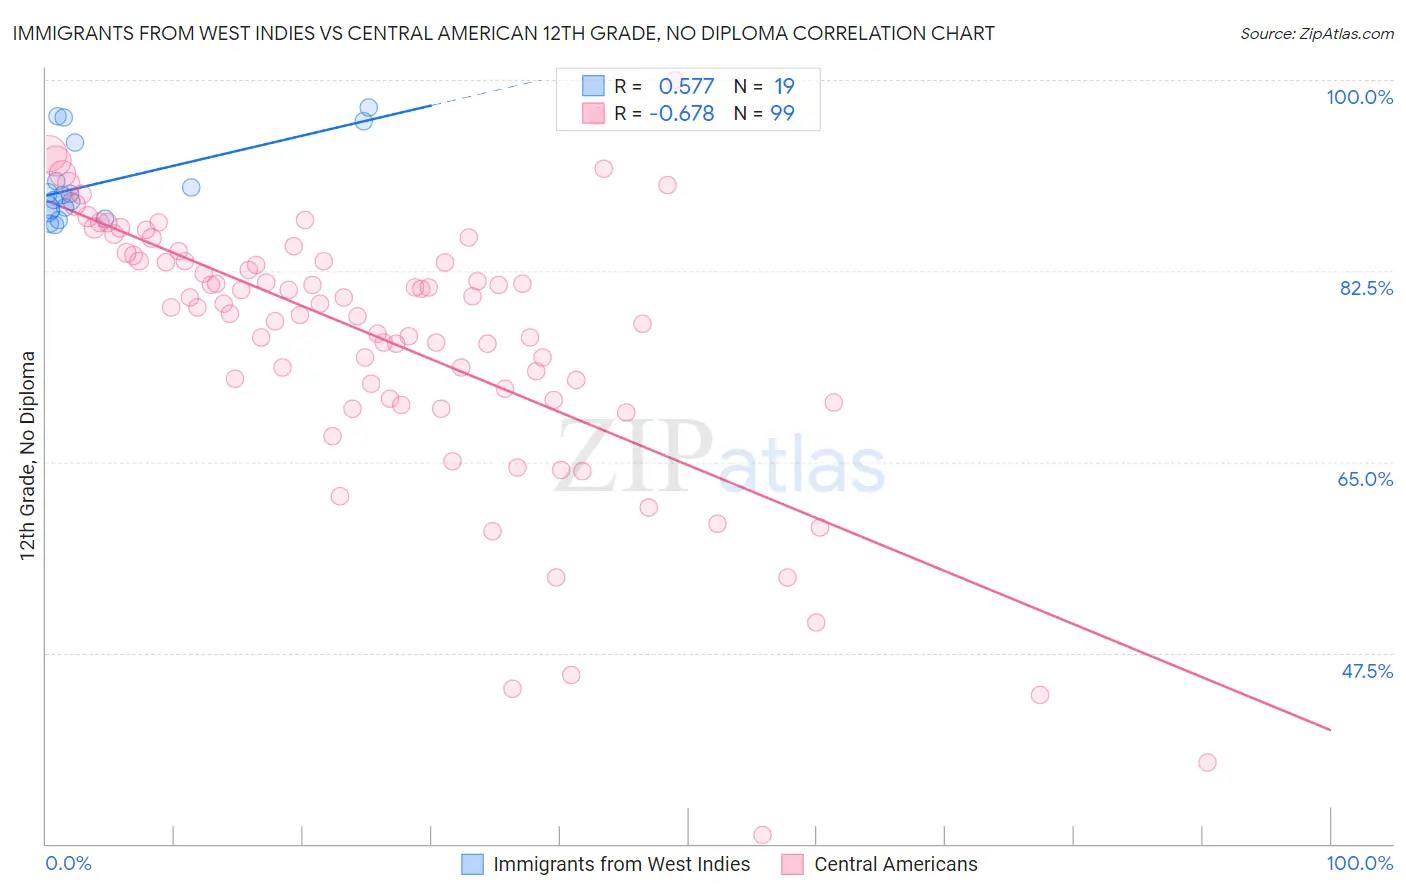
Immigrants from West Indies vs Central American 12th Grade, No Diploma Correlation Chart
The statistical analysis conducted on geographies consisting of 72,457,514 people shows a substantial positive correlation between the proportion of Immigrants from West Indies and percentage of population with at least 12th grade (no diploma) education in the United States with a correlation coefficient (R) of 0.577 and weighted average of 88.6%. Similarly, the statistical analysis conducted on geographies consisting of 504,619,347 people shows a significant negative correlation between the proportion of Central Americans and percentage of population with at least 12th grade (no diploma) education in the United States with a correlation coefficient (R) of -0.678 and weighted average of 85.2%, a difference of 4.0%.
12th Grade, No Diploma Correlation Summary
| Measurement | Immigrants from West Indies | Central American |
| Minimum | 86.7% | 30.8% |
| Maximum | 97.5% | 100.0% |
| Range | 10.8% | 69.2% |
| Mean | 90.6% | 76.2% |
| Median | 89.4% | 79.5% |
| Interquartile 25% (IQ1) | 88.1% | 70.8% |
| Interquartile 75% (IQ3) | 94.3% | 83.9% |
| Interquartile Range (IQR) | 6.2% | 13.1% |
| Standard Deviation (Sample) | 3.7% | 12.6% |
| Standard Deviation (Population) | 3.6% | 12.5% |
Similar Demographics by 12th Grade, No Diploma
Demographics Similar to Immigrants from West Indies by 12th Grade, No Diploma
In terms of 12th grade, no diploma, the demographic groups most similar to Immigrants from West Indies are Indonesian (88.6%, a difference of 0.0%), Hopi (88.6%, a difference of 0.010%), Immigrants from Fiji (88.6%, a difference of 0.010%), Pennsylvania German (88.7%, a difference of 0.020%), and Paiute (88.7%, a difference of 0.030%).
| Demographics | Rating | Rank | 12th Grade, No Diploma |
| Immigrants | Laos | 0.0 /100 | #279 | Tragic 88.9% |
| Immigrants | Burma/Myanmar | 0.0 /100 | #280 | Tragic 88.9% |
| Cubans | 0.0 /100 | #281 | Tragic 88.9% |
| Immigrants | Vietnam | 0.0 /100 | #282 | Tragic 88.7% |
| Paiute | 0.0 /100 | #283 | Tragic 88.7% |
| Pennsylvania Germans | 0.0 /100 | #284 | Tragic 88.7% |
| Indonesians | 0.0 /100 | #285 | Tragic 88.6% |
| Immigrants | West Indies | 0.0 /100 | #286 | Tragic 88.6% |
| Hopi | 0.0 /100 | #287 | Tragic 88.6% |
| Immigrants | Fiji | 0.0 /100 | #288 | Tragic 88.6% |
| Dutch West Indians | 0.0 /100 | #289 | Tragic 88.5% |
| British West Indians | 0.0 /100 | #290 | Tragic 88.5% |
| Haitians | 0.0 /100 | #291 | Tragic 88.5% |
| Immigrants | Grenada | 0.0 /100 | #292 | Tragic 88.4% |
| Japanese | 0.0 /100 | #293 | Tragic 88.3% |
Demographics Similar to Central Americans by 12th Grade, No Diploma
In terms of 12th grade, no diploma, the demographic groups most similar to Central Americans are Immigrants from the Azores (85.3%, a difference of 0.14%), Immigrants from Honduras (85.0%, a difference of 0.21%), Hispanic or Latino (85.4%, a difference of 0.28%), Immigrants from Latin America (85.0%, a difference of 0.28%), and Honduran (85.5%, a difference of 0.37%).
| Demographics | Rating | Rank | 12th Grade, No Diploma |
| Immigrants | Cabo Verde | 0.0 /100 | #324 | Tragic 85.8% |
| Mexican American Indians | 0.0 /100 | #325 | Tragic 85.7% |
| Dominicans | 0.0 /100 | #326 | Tragic 85.7% |
| Lumbee | 0.0 /100 | #327 | Tragic 85.7% |
| Hondurans | 0.0 /100 | #328 | Tragic 85.5% |
| Hispanics or Latinos | 0.0 /100 | #329 | Tragic 85.4% |
| Immigrants | Azores | 0.0 /100 | #330 | Tragic 85.3% |
| Central Americans | 0.0 /100 | #331 | Tragic 85.2% |
| Immigrants | Honduras | 0.0 /100 | #332 | Tragic 85.0% |
| Immigrants | Latin America | 0.0 /100 | #333 | Tragic 85.0% |
| Immigrants | Dominican Republic | 0.0 /100 | #334 | Tragic 84.9% |
| Immigrants | Yemen | 0.0 /100 | #335 | Tragic 84.8% |
| Tohono O'odham | 0.0 /100 | #336 | Tragic 84.7% |
| Pima | 0.0 /100 | #337 | Tragic 84.6% |
| Guatemalans | 0.0 /100 | #338 | Tragic 84.6% |