Immigrants from Vietnam vs Potawatomi Disability Age Under 5
COMPARE
Immigrants from Vietnam
Potawatomi
Disability Age Under 5
Disability Age Under 5 Comparison
Immigrants from Vietnam
Potawatomi
1.1%
DISABILITY AGE UNDER 5
99.1/ 100
METRIC RATING
63rd/ 347
METRIC RANK
1.4%
DISABILITY AGE UNDER 5
1.1/ 100
METRIC RATING
245th/ 347
METRIC RANK
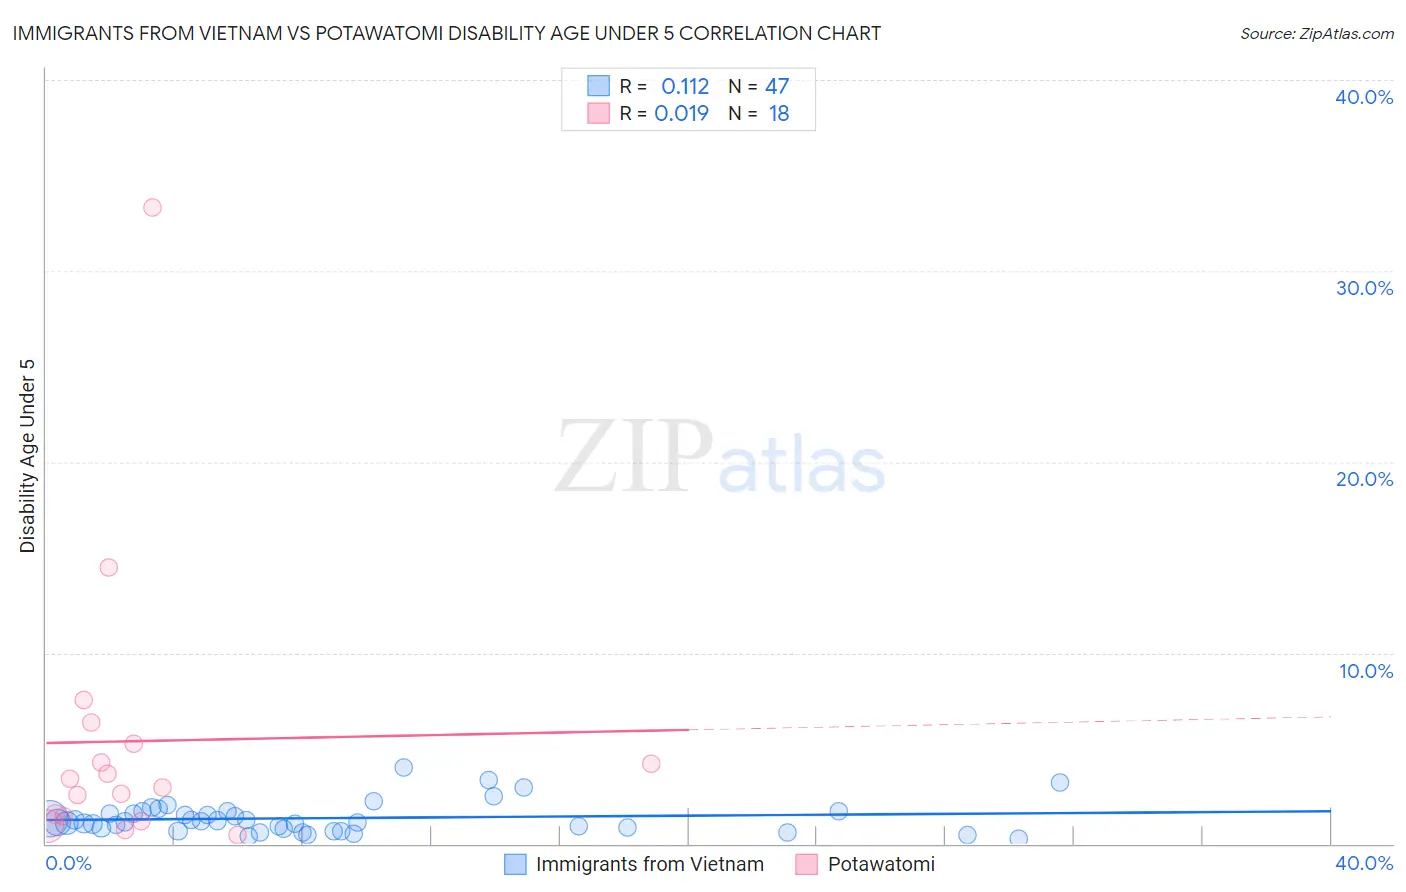
Immigrants from Vietnam vs Potawatomi Disability Age Under 5 Correlation Chart
The statistical analysis conducted on geographies consisting of 220,992,476 people shows a poor positive correlation between the proportion of Immigrants from Vietnam and percentage of population with a disability under the age of 5 in the United States with a correlation coefficient (R) of 0.112 and weighted average of 1.1%. Similarly, the statistical analysis conducted on geographies consisting of 88,888,283 people shows no correlation between the proportion of Potawatomi and percentage of population with a disability under the age of 5 in the United States with a correlation coefficient (R) of 0.019 and weighted average of 1.4%, a difference of 23.4%.
Disability Age Under 5 Correlation Summary
| Measurement | Immigrants from Vietnam | Potawatomi |
| Minimum | 0.25% | 0.43% |
| Maximum | 4.0% | 33.3% |
| Range | 3.8% | 32.9% |
| Mean | 1.3% | 5.4% |
| Median | 1.1% | 3.2% |
| Interquartile 25% (IQ1) | 0.81% | 1.5% |
| Interquartile 75% (IQ3) | 1.7% | 5.3% |
| Interquartile Range (IQR) | 0.87% | 3.8% |
| Standard Deviation (Sample) | 0.81% | 7.7% |
| Standard Deviation (Population) | 0.80% | 7.5% |
Similar Demographics by Disability Age Under 5
Demographics Similar to Immigrants from Vietnam by Disability Age Under 5
In terms of disability age under 5, the demographic groups most similar to Immigrants from Vietnam are Immigrants from Switzerland (1.1%, a difference of 0.11%), Immigrants from Ethiopia (1.1%, a difference of 0.12%), Immigrants from Western Asia (1.1%, a difference of 0.18%), Egyptian (1.1%, a difference of 0.46%), and Immigrants from Korea (1.1%, a difference of 0.80%).
| Demographics | Rating | Rank | Disability Age Under 5 |
| Ecuadorians | 99.5 /100 | #56 | Exceptional 1.1% |
| Assyrians/Chaldeans/Syriacs | 99.5 /100 | #57 | Exceptional 1.1% |
| Immigrants | Egypt | 99.4 /100 | #58 | Exceptional 1.1% |
| Immigrants | Malaysia | 99.4 /100 | #59 | Exceptional 1.1% |
| Immigrants | Western Asia | 99.2 /100 | #60 | Exceptional 1.1% |
| Immigrants | Ethiopia | 99.2 /100 | #61 | Exceptional 1.1% |
| Immigrants | Switzerland | 99.2 /100 | #62 | Exceptional 1.1% |
| Immigrants | Vietnam | 99.1 /100 | #63 | Exceptional 1.1% |
| Egyptians | 98.9 /100 | #64 | Exceptional 1.1% |
| Immigrants | Korea | 98.8 /100 | #65 | Exceptional 1.1% |
| Immigrants | Indonesia | 98.7 /100 | #66 | Exceptional 1.1% |
| Immigrants | Belize | 98.7 /100 | #67 | Exceptional 1.1% |
| South Africans | 98.7 /100 | #68 | Exceptional 1.1% |
| Israelis | 98.7 /100 | #69 | Exceptional 1.1% |
| Immigrants | Ecuador | 98.6 /100 | #70 | Exceptional 1.1% |
Demographics Similar to Potawatomi by Disability Age Under 5
In terms of disability age under 5, the demographic groups most similar to Potawatomi are Russian (1.4%, a difference of 0.13%), Immigrants from England (1.4%, a difference of 0.14%), Eastern European (1.4%, a difference of 0.17%), Bermudan (1.4%, a difference of 0.25%), and African (1.4%, a difference of 0.26%).
| Demographics | Rating | Rank | Disability Age Under 5 |
| Spanish American Indians | 2.4 /100 | #238 | Tragic 1.3% |
| Immigrants | Austria | 2.3 /100 | #239 | Tragic 1.3% |
| Native Hawaiians | 2.2 /100 | #240 | Tragic 1.3% |
| Maltese | 2.2 /100 | #241 | Tragic 1.3% |
| Lumbee | 2.1 /100 | #242 | Tragic 1.3% |
| Immigrants | Cameroon | 1.7 /100 | #243 | Tragic 1.4% |
| Spaniards | 1.4 /100 | #244 | Tragic 1.4% |
| Potawatomi | 1.1 /100 | #245 | Tragic 1.4% |
| Russians | 1.0 /100 | #246 | Tragic 1.4% |
| Immigrants | England | 1.0 /100 | #247 | Tragic 1.4% |
| Eastern Europeans | 1.0 /100 | #248 | Tragic 1.4% |
| Bermudans | 1.0 /100 | #249 | Tragic 1.4% |
| Africans | 1.0 /100 | #250 | Tragic 1.4% |
| Immigrants | Hungary | 1.0 /100 | #251 | Tragic 1.4% |
| Immigrants | Scotland | 0.9 /100 | #252 | Tragic 1.4% |