Immigrants from Vietnam vs Potawatomi Nursery School
COMPARE
Immigrants from Vietnam
Potawatomi
Nursery School
Nursery School Comparison
Immigrants from Vietnam
Potawatomi
96.7%
NURSERY SCHOOL
0.0/ 100
METRIC RATING
329th/ 347
METRIC RANK
98.3%
NURSERY SCHOOL
99.2/ 100
METRIC RATING
82nd/ 347
METRIC RANK
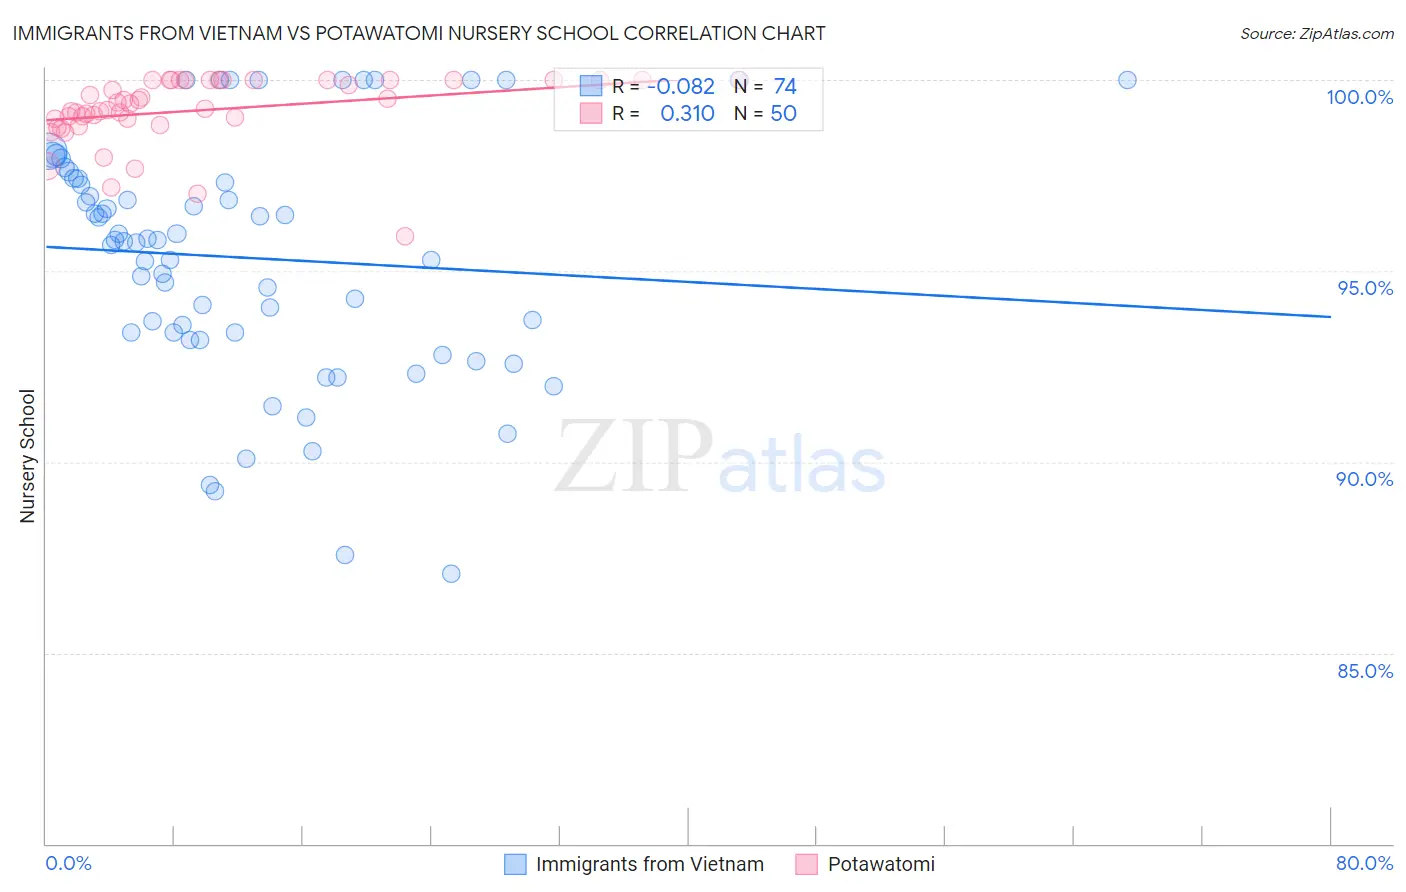
Immigrants from Vietnam vs Potawatomi Nursery School Correlation Chart
The statistical analysis conducted on geographies consisting of 404,844,130 people shows a slight negative correlation between the proportion of Immigrants from Vietnam and percentage of population with at least nursery school education in the United States with a correlation coefficient (R) of -0.082 and weighted average of 96.7%. Similarly, the statistical analysis conducted on geographies consisting of 117,769,196 people shows a mild positive correlation between the proportion of Potawatomi and percentage of population with at least nursery school education in the United States with a correlation coefficient (R) of 0.310 and weighted average of 98.3%, a difference of 1.7%.
Nursery School Correlation Summary
| Measurement | Immigrants from Vietnam | Potawatomi |
| Minimum | 87.1% | 95.9% |
| Maximum | 100.0% | 100.0% |
| Range | 12.9% | 4.1% |
| Mean | 95.3% | 99.2% |
| Median | 95.8% | 99.3% |
| Interquartile 25% (IQ1) | 93.4% | 99.0% |
| Interquartile 75% (IQ3) | 97.4% | 100.0% |
| Interquartile Range (IQR) | 4.0% | 1.0% |
| Standard Deviation (Sample) | 3.1% | 0.89% |
| Standard Deviation (Population) | 3.1% | 0.88% |
Similar Demographics by Nursery School
Demographics Similar to Immigrants from Vietnam by Nursery School
In terms of nursery school, the demographic groups most similar to Immigrants from Vietnam are Japanese (96.7%, a difference of 0.010%), Immigrants from Armenia (96.7%, a difference of 0.030%), Immigrants from Latin America (96.7%, a difference of 0.050%), Yakama (96.6%, a difference of 0.050%), and Mexican (96.8%, a difference of 0.060%).
| Demographics | Rating | Rank | Nursery School |
| Mexican American Indians | 0.0 /100 | #322 | Tragic 96.9% |
| Immigrants | Honduras | 0.0 /100 | #323 | Tragic 96.9% |
| Vietnamese | 0.0 /100 | #324 | Tragic 96.8% |
| Dominicans | 0.0 /100 | #325 | Tragic 96.8% |
| Indonesians | 0.0 /100 | #326 | Tragic 96.8% |
| Mexicans | 0.0 /100 | #327 | Tragic 96.8% |
| Immigrants | Latin America | 0.0 /100 | #328 | Tragic 96.7% |
| Immigrants | Vietnam | 0.0 /100 | #329 | Tragic 96.7% |
| Japanese | 0.0 /100 | #330 | Tragic 96.7% |
| Immigrants | Armenia | 0.0 /100 | #331 | Tragic 96.7% |
| Yakama | 0.0 /100 | #332 | Tragic 96.6% |
| Central Americans | 0.0 /100 | #333 | Tragic 96.6% |
| Immigrants | Dominican Republic | 0.0 /100 | #334 | Tragic 96.6% |
| Bangladeshis | 0.0 /100 | #335 | Tragic 96.6% |
| Guatemalans | 0.0 /100 | #336 | Tragic 96.6% |
Demographics Similar to Potawatomi by Nursery School
In terms of nursery school, the demographic groups most similar to Potawatomi are Icelander (98.3%, a difference of 0.0%), Cherokee (98.3%, a difference of 0.010%), Immigrants from England (98.3%, a difference of 0.010%), Immigrants from Lithuania (98.3%, a difference of 0.010%), and Delaware (98.3%, a difference of 0.010%).
| Demographics | Rating | Rank | Nursery School |
| Cherokee | 99.3 /100 | #75 | Exceptional 98.3% |
| Immigrants | England | 99.3 /100 | #76 | Exceptional 98.3% |
| Immigrants | Lithuania | 99.3 /100 | #77 | Exceptional 98.3% |
| Delaware | 99.3 /100 | #78 | Exceptional 98.3% |
| Immigrants | Belgium | 99.3 /100 | #79 | Exceptional 98.3% |
| Shoshone | 99.3 /100 | #80 | Exceptional 98.3% |
| Icelanders | 99.2 /100 | #81 | Exceptional 98.3% |
| Potawatomi | 99.2 /100 | #82 | Exceptional 98.3% |
| Osage | 99.1 /100 | #83 | Exceptional 98.3% |
| Immigrants | Denmark | 99.1 /100 | #84 | Exceptional 98.3% |
| Immigrants | Sweden | 99.1 /100 | #85 | Exceptional 98.3% |
| Immigrants | Australia | 99.0 /100 | #86 | Exceptional 98.3% |
| Hopi | 98.9 /100 | #87 | Exceptional 98.3% |
| Ukrainians | 98.9 /100 | #88 | Exceptional 98.3% |
| Immigrants | South Africa | 98.8 /100 | #89 | Exceptional 98.3% |