Immigrants from Vietnam vs Chinese Disability Age Under 5
COMPARE
Immigrants from Vietnam
Chinese
Disability Age Under 5
Disability Age Under 5 Comparison
Immigrants from Vietnam
Chinese
1.1%
DISABILITY AGE UNDER 5
99.1/ 100
METRIC RATING
63rd/ 347
METRIC RANK
1.1%
DISABILITY AGE UNDER 5
97.2/ 100
METRIC RATING
90th/ 347
METRIC RANK
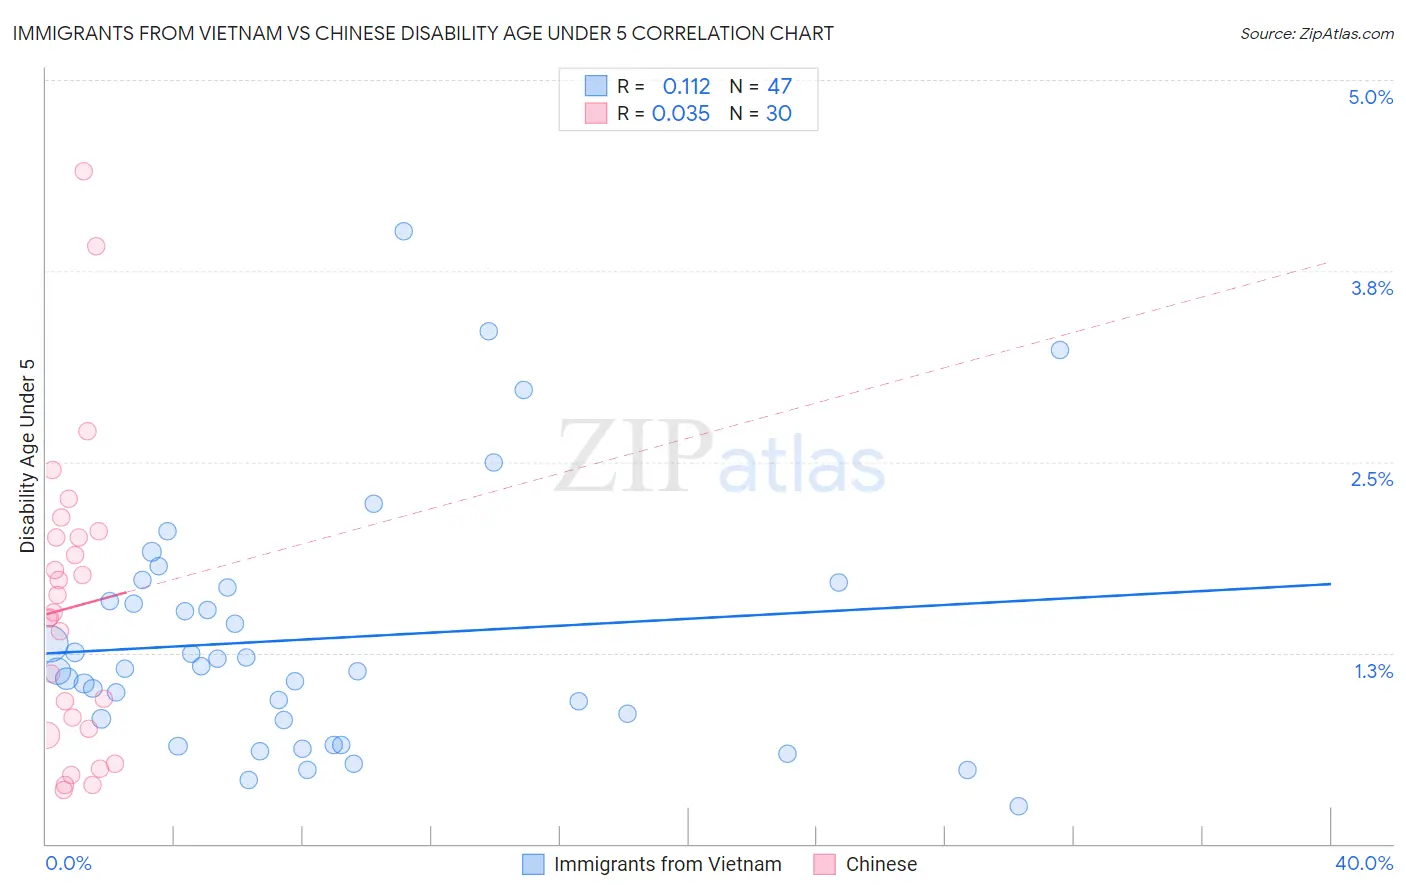
Immigrants from Vietnam vs Chinese Disability Age Under 5 Correlation Chart
The statistical analysis conducted on geographies consisting of 220,992,476 people shows a poor positive correlation between the proportion of Immigrants from Vietnam and percentage of population with a disability under the age of 5 in the United States with a correlation coefficient (R) of 0.112 and weighted average of 1.1%. Similarly, the statistical analysis conducted on geographies consisting of 53,046,332 people shows no correlation between the proportion of Chinese and percentage of population with a disability under the age of 5 in the United States with a correlation coefficient (R) of 0.035 and weighted average of 1.1%, a difference of 3.0%.
Disability Age Under 5 Correlation Summary
| Measurement | Immigrants from Vietnam | Chinese |
| Minimum | 0.25% | 0.35% |
| Maximum | 4.0% | 4.4% |
| Range | 3.8% | 4.0% |
| Mean | 1.3% | 1.5% |
| Median | 1.1% | 1.5% |
| Interquartile 25% (IQ1) | 0.81% | 0.75% |
| Interquartile 75% (IQ3) | 1.7% | 2.0% |
| Interquartile Range (IQR) | 0.87% | 1.3% |
| Standard Deviation (Sample) | 0.81% | 0.98% |
| Standard Deviation (Population) | 0.80% | 0.97% |
Similar Demographics by Disability Age Under 5
Demographics Similar to Immigrants from Vietnam by Disability Age Under 5
In terms of disability age under 5, the demographic groups most similar to Immigrants from Vietnam are Immigrants from Switzerland (1.1%, a difference of 0.11%), Immigrants from Ethiopia (1.1%, a difference of 0.12%), Immigrants from Western Asia (1.1%, a difference of 0.18%), Egyptian (1.1%, a difference of 0.46%), and Immigrants from Korea (1.1%, a difference of 0.80%).
| Demographics | Rating | Rank | Disability Age Under 5 |
| Ecuadorians | 99.5 /100 | #56 | Exceptional 1.1% |
| Assyrians/Chaldeans/Syriacs | 99.5 /100 | #57 | Exceptional 1.1% |
| Immigrants | Egypt | 99.4 /100 | #58 | Exceptional 1.1% |
| Immigrants | Malaysia | 99.4 /100 | #59 | Exceptional 1.1% |
| Immigrants | Western Asia | 99.2 /100 | #60 | Exceptional 1.1% |
| Immigrants | Ethiopia | 99.2 /100 | #61 | Exceptional 1.1% |
| Immigrants | Switzerland | 99.2 /100 | #62 | Exceptional 1.1% |
| Immigrants | Vietnam | 99.1 /100 | #63 | Exceptional 1.1% |
| Egyptians | 98.9 /100 | #64 | Exceptional 1.1% |
| Immigrants | Korea | 98.8 /100 | #65 | Exceptional 1.1% |
| Immigrants | Indonesia | 98.7 /100 | #66 | Exceptional 1.1% |
| Immigrants | Belize | 98.7 /100 | #67 | Exceptional 1.1% |
| South Africans | 98.7 /100 | #68 | Exceptional 1.1% |
| Israelis | 98.7 /100 | #69 | Exceptional 1.1% |
| Immigrants | Ecuador | 98.6 /100 | #70 | Exceptional 1.1% |
Demographics Similar to Chinese by Disability Age Under 5
In terms of disability age under 5, the demographic groups most similar to Chinese are Ethiopian (1.1%, a difference of 0.030%), Albanian (1.1%, a difference of 0.040%), Immigrants from Cuba (1.1%, a difference of 0.21%), Spanish American (1.1%, a difference of 0.24%), and Sri Lankan (1.1%, a difference of 0.30%).
| Demographics | Rating | Rank | Disability Age Under 5 |
| Immigrants | Syria | 97.9 /100 | #83 | Exceptional 1.1% |
| Immigrants | Zaire | 97.8 /100 | #84 | Exceptional 1.1% |
| Sudanese | 97.7 /100 | #85 | Exceptional 1.1% |
| Okinawans | 97.6 /100 | #86 | Exceptional 1.1% |
| Ugandans | 97.5 /100 | #87 | Exceptional 1.1% |
| Immigrants | Dominican Republic | 97.5 /100 | #88 | Exceptional 1.1% |
| Ethiopians | 97.2 /100 | #89 | Exceptional 1.1% |
| Chinese | 97.2 /100 | #90 | Exceptional 1.1% |
| Albanians | 97.2 /100 | #91 | Exceptional 1.1% |
| Immigrants | Cuba | 97.0 /100 | #92 | Exceptional 1.1% |
| Spanish Americans | 96.9 /100 | #93 | Exceptional 1.1% |
| Sri Lankans | 96.8 /100 | #94 | Exceptional 1.1% |
| Immigrants | Moldova | 96.8 /100 | #95 | Exceptional 1.1% |
| Mongolians | 96.6 /100 | #96 | Exceptional 1.1% |
| Immigrants | Iraq | 96.5 /100 | #97 | Exceptional 1.1% |