Immigrants from Germany vs Potawatomi Disability Age Under 5
COMPARE
Immigrants from Germany
Potawatomi
Disability Age Under 5
Disability Age Under 5 Comparison
Immigrants from Germany
Potawatomi
1.4%
DISABILITY AGE UNDER 5
0.1/ 100
METRIC RATING
266th/ 347
METRIC RANK
1.4%
DISABILITY AGE UNDER 5
1.1/ 100
METRIC RATING
245th/ 347
METRIC RANK
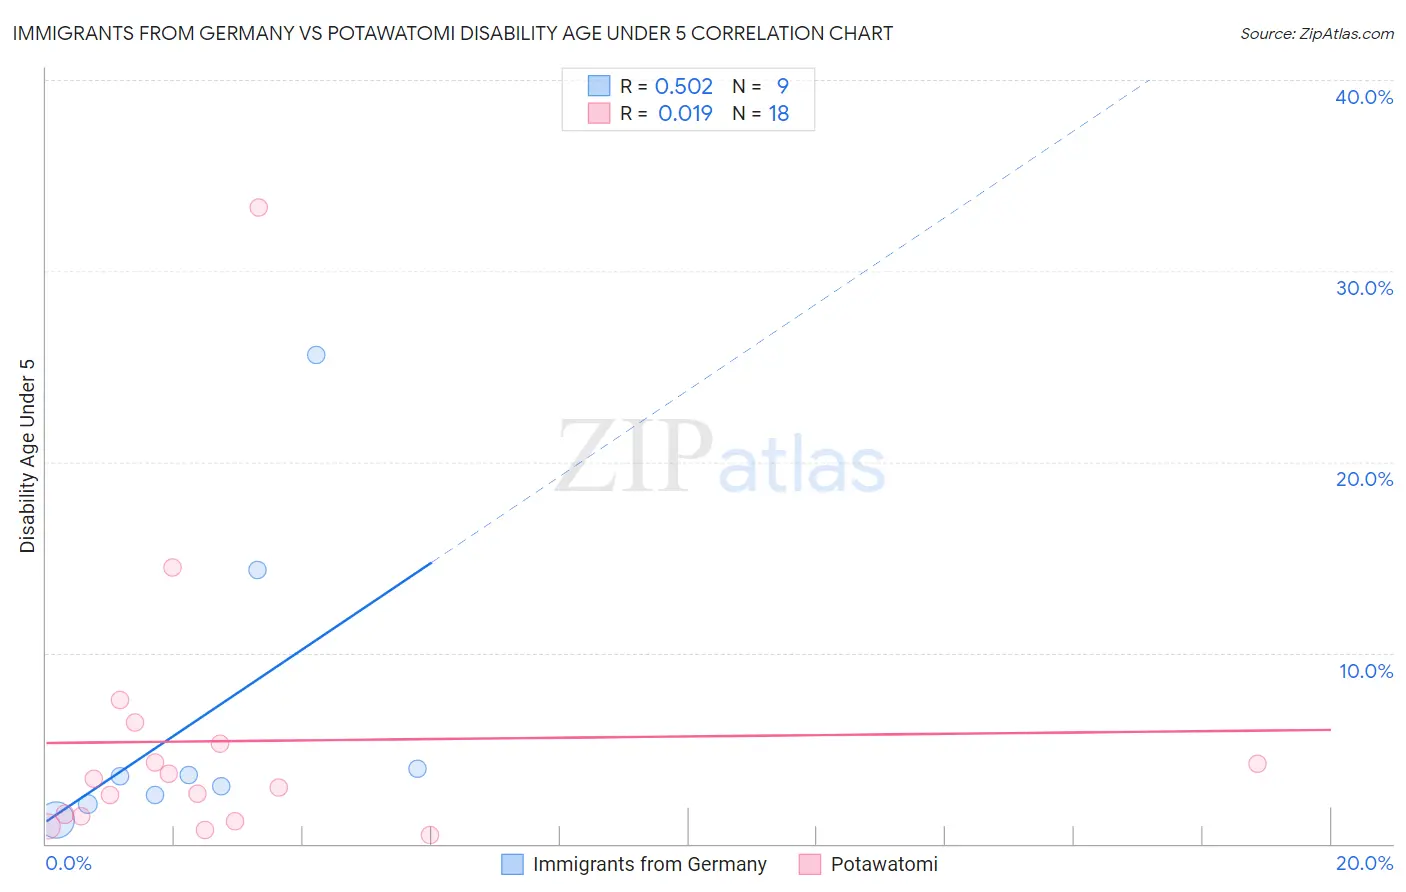
Immigrants from Germany vs Potawatomi Disability Age Under 5 Correlation Chart
The statistical analysis conducted on geographies consisting of 235,379,937 people shows a substantial positive correlation between the proportion of Immigrants from Germany and percentage of population with a disability under the age of 5 in the United States with a correlation coefficient (R) of 0.502 and weighted average of 1.4%. Similarly, the statistical analysis conducted on geographies consisting of 88,888,283 people shows no correlation between the proportion of Potawatomi and percentage of population with a disability under the age of 5 in the United States with a correlation coefficient (R) of 0.019 and weighted average of 1.4%, a difference of 4.2%.
Disability Age Under 5 Correlation Summary
| Measurement | Immigrants from Germany | Potawatomi |
| Minimum | 1.3% | 0.43% |
| Maximum | 25.6% | 33.3% |
| Range | 24.3% | 32.9% |
| Mean | 6.7% | 5.4% |
| Median | 3.6% | 3.2% |
| Interquartile 25% (IQ1) | 2.3% | 1.5% |
| Interquartile 75% (IQ3) | 9.1% | 5.3% |
| Interquartile Range (IQR) | 6.8% | 3.8% |
| Standard Deviation (Sample) | 8.1% | 7.7% |
| Standard Deviation (Population) | 7.6% | 7.5% |
Similar Demographics by Disability Age Under 5
Demographics Similar to Immigrants from Germany by Disability Age Under 5
In terms of disability age under 5, the demographic groups most similar to Immigrants from Germany are Carpatho Rusyn (1.4%, a difference of 0.030%), Yugoslavian (1.4%, a difference of 0.080%), Spanish (1.4%, a difference of 0.22%), Immigrants from Dominica (1.4%, a difference of 0.28%), and Immigrants from Netherlands (1.4%, a difference of 0.44%).
| Demographics | Rating | Rank | Disability Age Under 5 |
| Immigrants | Southern Europe | 0.3 /100 | #259 | Tragic 1.4% |
| Slavs | 0.3 /100 | #260 | Tragic 1.4% |
| Immigrants | Netherlands | 0.2 /100 | #261 | Tragic 1.4% |
| Immigrants | Dominica | 0.2 /100 | #262 | Tragic 1.4% |
| Spanish | 0.2 /100 | #263 | Tragic 1.4% |
| Yugoslavians | 0.1 /100 | #264 | Tragic 1.4% |
| Carpatho Rusyns | 0.1 /100 | #265 | Tragic 1.4% |
| Immigrants | Germany | 0.1 /100 | #266 | Tragic 1.4% |
| Cree | 0.1 /100 | #267 | Tragic 1.4% |
| Belgians | 0.1 /100 | #268 | Tragic 1.4% |
| Austrians | 0.1 /100 | #269 | Tragic 1.4% |
| Immigrants | North America | 0.1 /100 | #270 | Tragic 1.4% |
| Immigrants | Canada | 0.1 /100 | #271 | Tragic 1.4% |
| Blacks/African Americans | 0.1 /100 | #272 | Tragic 1.4% |
| Alaskan Athabascans | 0.1 /100 | #273 | Tragic 1.5% |
Demographics Similar to Potawatomi by Disability Age Under 5
In terms of disability age under 5, the demographic groups most similar to Potawatomi are Russian (1.4%, a difference of 0.13%), Immigrants from England (1.4%, a difference of 0.14%), Eastern European (1.4%, a difference of 0.17%), Bermudan (1.4%, a difference of 0.25%), and African (1.4%, a difference of 0.26%).
| Demographics | Rating | Rank | Disability Age Under 5 |
| Spanish American Indians | 2.4 /100 | #238 | Tragic 1.3% |
| Immigrants | Austria | 2.3 /100 | #239 | Tragic 1.3% |
| Native Hawaiians | 2.2 /100 | #240 | Tragic 1.3% |
| Maltese | 2.2 /100 | #241 | Tragic 1.3% |
| Lumbee | 2.1 /100 | #242 | Tragic 1.3% |
| Immigrants | Cameroon | 1.7 /100 | #243 | Tragic 1.4% |
| Spaniards | 1.4 /100 | #244 | Tragic 1.4% |
| Potawatomi | 1.1 /100 | #245 | Tragic 1.4% |
| Russians | 1.0 /100 | #246 | Tragic 1.4% |
| Immigrants | England | 1.0 /100 | #247 | Tragic 1.4% |
| Eastern Europeans | 1.0 /100 | #248 | Tragic 1.4% |
| Bermudans | 1.0 /100 | #249 | Tragic 1.4% |
| Africans | 1.0 /100 | #250 | Tragic 1.4% |
| Immigrants | Hungary | 1.0 /100 | #251 | Tragic 1.4% |
| Immigrants | Scotland | 0.9 /100 | #252 | Tragic 1.4% |