Immigrants from Venezuela vs Serbian Unemployment Among Seniors over 65 years
COMPARE
Immigrants from Venezuela
Serbian
Unemployment Among Seniors over 65 years
Unemployment Among Seniors over 65 years Comparison
Immigrants from Venezuela
Serbians
5.5%
UNEMPLOYMENT AMONG SENIORS OVER 65 YEARS
0.0/ 100
METRIC RATING
293rd/ 347
METRIC RANK
5.0%
UNEMPLOYMENT AMONG SENIORS OVER 65 YEARS
98.4/ 100
METRIC RATING
82nd/ 347
METRIC RANK
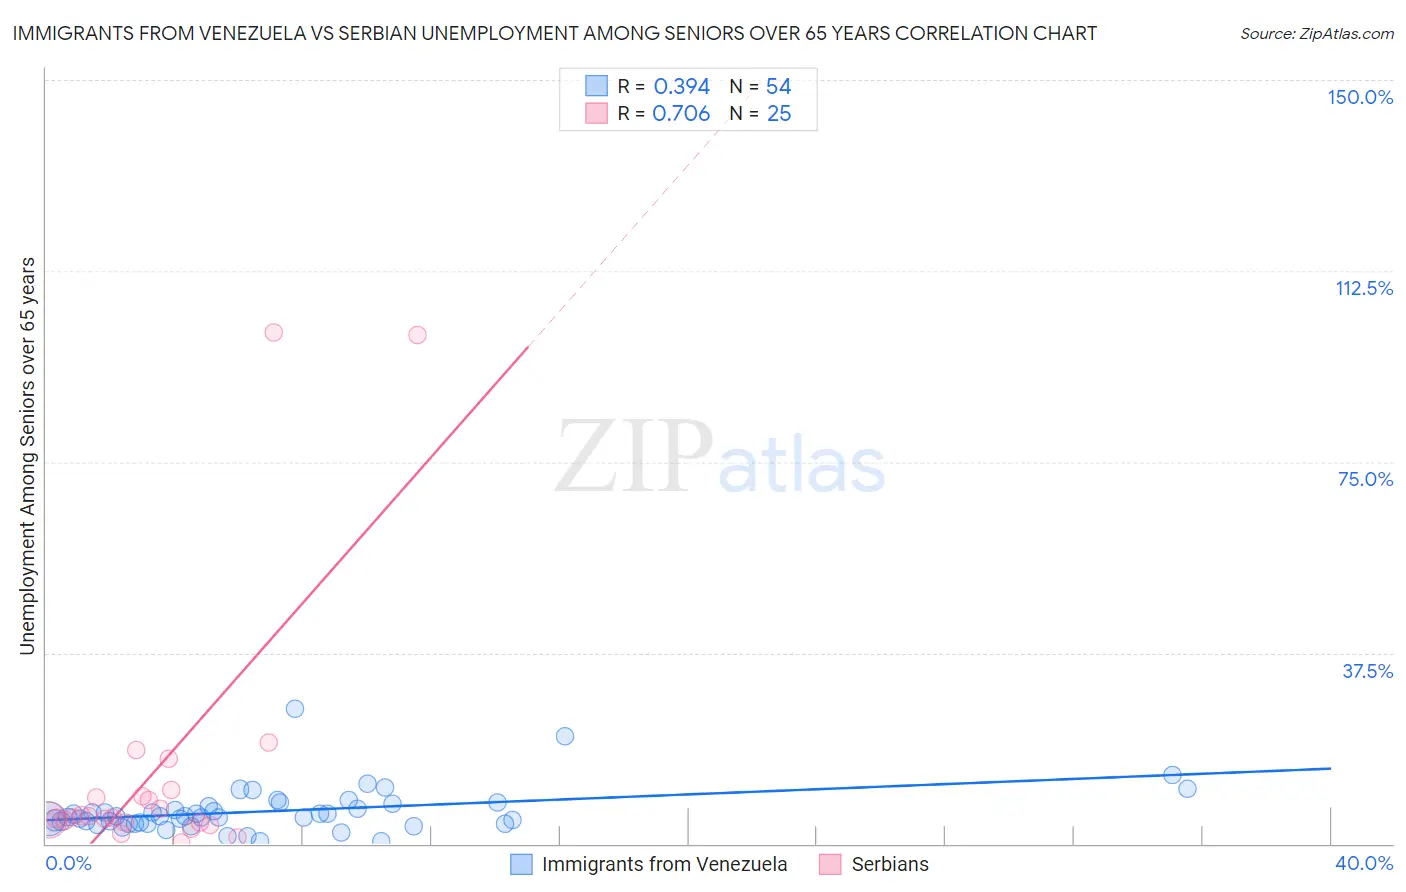
Immigrants from Venezuela vs Serbian Unemployment Among Seniors over 65 years Correlation Chart
The statistical analysis conducted on geographies consisting of 268,216,746 people shows a mild positive correlation between the proportion of Immigrants from Venezuela and unemployment rate amomg seniors over the age of 65 in the United States with a correlation coefficient (R) of 0.394 and weighted average of 5.5%. Similarly, the statistical analysis conducted on geographies consisting of 247,718,155 people shows a strong positive correlation between the proportion of Serbians and unemployment rate amomg seniors over the age of 65 in the United States with a correlation coefficient (R) of 0.706 and weighted average of 5.0%, a difference of 11.3%.
Unemployment Among Seniors over 65 years Correlation Summary
| Measurement | Immigrants from Venezuela | Serbian |
| Minimum | 0.40% | 0.30% |
| Maximum | 26.5% | 100.4% |
| Range | 26.1% | 100.1% |
| Mean | 6.4% | 14.4% |
| Median | 5.3% | 5.2% |
| Interquartile 25% (IQ1) | 4.0% | 4.2% |
| Interquartile 75% (IQ3) | 7.5% | 10.0% |
| Interquartile Range (IQR) | 3.4% | 5.8% |
| Standard Deviation (Sample) | 4.4% | 26.3% |
| Standard Deviation (Population) | 4.4% | 25.8% |
Similar Demographics by Unemployment Among Seniors over 65 years
Demographics Similar to Immigrants from Venezuela by Unemployment Among Seniors over 65 years
In terms of unemployment among seniors over 65 years, the demographic groups most similar to Immigrants from Venezuela are Belizean (5.5%, a difference of 0.040%), Armenian (5.5%, a difference of 0.040%), Cheyenne (5.5%, a difference of 0.11%), Cape Verdean (5.5%, a difference of 0.11%), and Yaqui (5.5%, a difference of 0.12%).
| Demographics | Rating | Rank | Unemployment Among Seniors over 65 years |
| Immigrants | Barbados | 0.0 /100 | #286 | Tragic 5.5% |
| Venezuelans | 0.0 /100 | #287 | Tragic 5.5% |
| U.S. Virgin Islanders | 0.0 /100 | #288 | Tragic 5.5% |
| Immigrants | Cabo Verde | 0.0 /100 | #289 | Tragic 5.5% |
| Jamaicans | 0.0 /100 | #290 | Tragic 5.5% |
| Blacks/African Americans | 0.0 /100 | #291 | Tragic 5.5% |
| Belizeans | 0.0 /100 | #292 | Tragic 5.5% |
| Immigrants | Venezuela | 0.0 /100 | #293 | Tragic 5.5% |
| Armenians | 0.0 /100 | #294 | Tragic 5.5% |
| Cheyenne | 0.0 /100 | #295 | Tragic 5.5% |
| Cape Verdeans | 0.0 /100 | #296 | Tragic 5.5% |
| Yaqui | 0.0 /100 | #297 | Tragic 5.5% |
| Immigrants | West Indies | 0.0 /100 | #298 | Tragic 5.6% |
| Guyanese | 0.0 /100 | #299 | Tragic 5.6% |
| Zimbabweans | 0.0 /100 | #300 | Tragic 5.6% |
Demographics Similar to Serbians by Unemployment Among Seniors over 65 years
In terms of unemployment among seniors over 65 years, the demographic groups most similar to Serbians are Estonian (5.0%, a difference of 0.030%), Immigrants from Zimbabwe (5.0%, a difference of 0.030%), Filipino (5.0%, a difference of 0.040%), Immigrants from Hungary (5.0%, a difference of 0.10%), and Immigrants from Taiwan (5.0%, a difference of 0.11%).
| Demographics | Rating | Rank | Unemployment Among Seniors over 65 years |
| British | 99.1 /100 | #75 | Exceptional 4.9% |
| Welsh | 99.1 /100 | #76 | Exceptional 5.0% |
| Thais | 99.1 /100 | #77 | Exceptional 5.0% |
| Slavs | 98.9 /100 | #78 | Exceptional 5.0% |
| Immigrants | Netherlands | 98.8 /100 | #79 | Exceptional 5.0% |
| Immigrants | Ethiopia | 98.6 /100 | #80 | Exceptional 5.0% |
| Estonians | 98.5 /100 | #81 | Exceptional 5.0% |
| Serbians | 98.4 /100 | #82 | Exceptional 5.0% |
| Immigrants | Zimbabwe | 98.3 /100 | #83 | Exceptional 5.0% |
| Filipinos | 98.3 /100 | #84 | Exceptional 5.0% |
| Immigrants | Hungary | 98.2 /100 | #85 | Exceptional 5.0% |
| Immigrants | Taiwan | 98.2 /100 | #86 | Exceptional 5.0% |
| Immigrants | Switzerland | 98.2 /100 | #87 | Exceptional 5.0% |
| Afghans | 97.6 /100 | #88 | Exceptional 5.0% |
| Immigrants | South Central Asia | 97.6 /100 | #89 | Exceptional 5.0% |