Immigrants from Venezuela vs Croatian Ambulatory Disability
COMPARE
Immigrants from Venezuela
Croatian
Ambulatory Disability
Ambulatory Disability Comparison
Immigrants from Venezuela
Croatians
5.4%
AMBULATORY DISABILITY
100.0/ 100
METRIC RATING
31st/ 347
METRIC RANK
6.1%
AMBULATORY DISABILITY
51.2/ 100
METRIC RATING
173rd/ 347
METRIC RANK
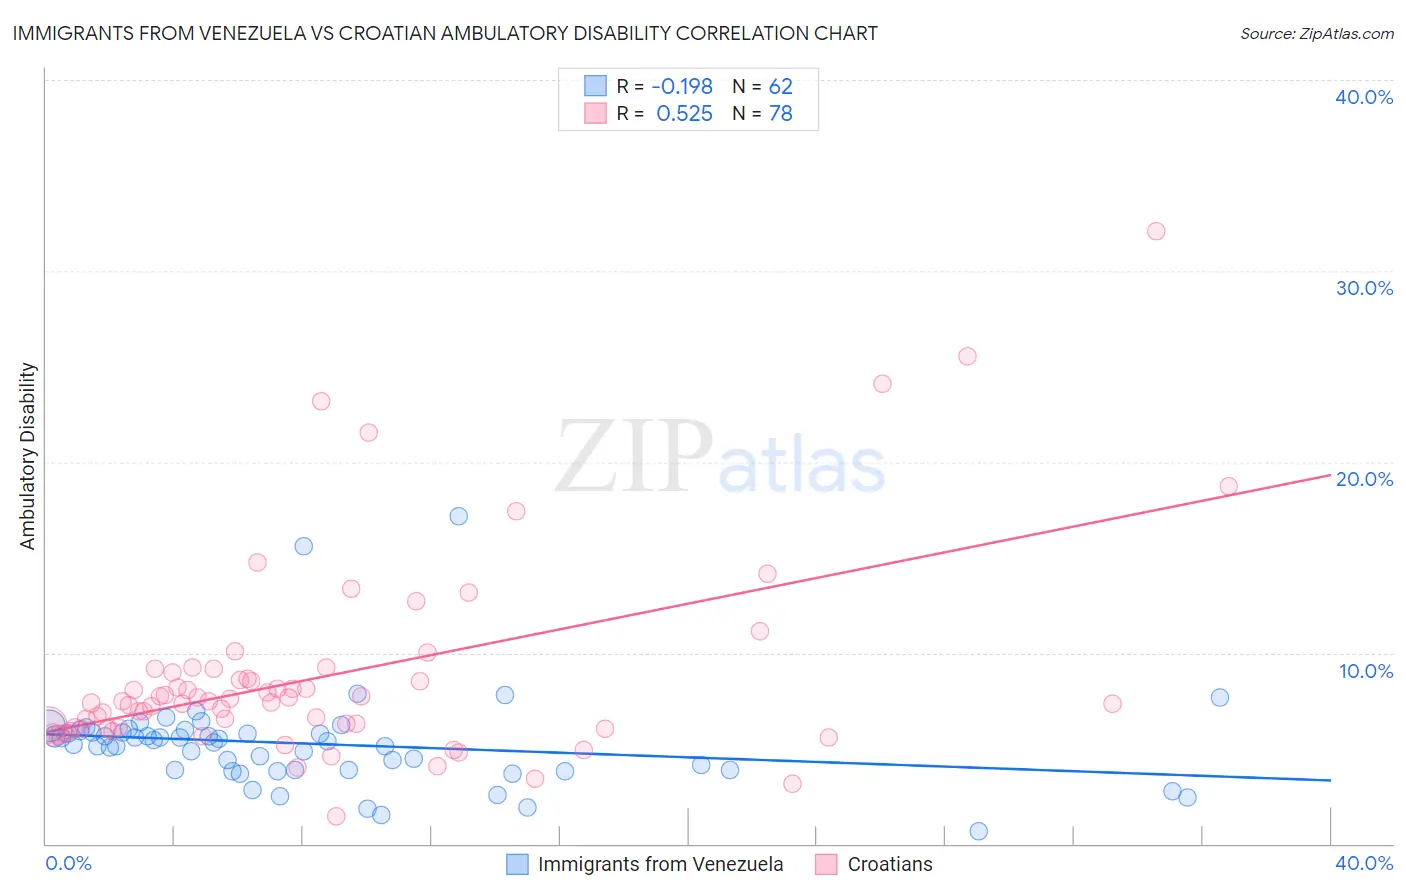
Immigrants from Venezuela vs Croatian Ambulatory Disability Correlation Chart
The statistical analysis conducted on geographies consisting of 287,823,079 people shows a poor negative correlation between the proportion of Immigrants from Venezuela and percentage of population with ambulatory disability in the United States with a correlation coefficient (R) of -0.198 and weighted average of 5.4%. Similarly, the statistical analysis conducted on geographies consisting of 375,651,055 people shows a substantial positive correlation between the proportion of Croatians and percentage of population with ambulatory disability in the United States with a correlation coefficient (R) of 0.525 and weighted average of 6.1%, a difference of 12.2%.
Ambulatory Disability Correlation Summary
| Measurement | Immigrants from Venezuela | Croatian |
| Minimum | 0.63% | 1.5% |
| Maximum | 17.1% | 32.1% |
| Range | 16.5% | 30.6% |
| Mean | 5.2% | 8.8% |
| Median | 5.3% | 7.4% |
| Interquartile 25% (IQ1) | 3.8% | 6.1% |
| Interquartile 75% (IQ3) | 5.8% | 8.9% |
| Interquartile Range (IQR) | 2.0% | 2.9% |
| Standard Deviation (Sample) | 2.6% | 5.3% |
| Standard Deviation (Population) | 2.5% | 5.2% |
Similar Demographics by Ambulatory Disability
Demographics Similar to Immigrants from Venezuela by Ambulatory Disability
In terms of ambulatory disability, the demographic groups most similar to Immigrants from Venezuela are Immigrants from Turkey (5.4%, a difference of 0.020%), Immigrants from Australia (5.5%, a difference of 0.17%), Immigrants from Pakistan (5.5%, a difference of 0.29%), Immigrants from Asia (5.5%, a difference of 0.44%), and Afghan (5.5%, a difference of 0.49%).
| Demographics | Rating | Rank | Ambulatory Disability |
| Immigrants | Saudi Arabia | 100.0 /100 | #24 | Exceptional 5.4% |
| Zimbabweans | 100.0 /100 | #25 | Exceptional 5.4% |
| Immigrants | Nepal | 100.0 /100 | #26 | Exceptional 5.4% |
| Asians | 100.0 /100 | #27 | Exceptional 5.4% |
| Cambodians | 100.0 /100 | #28 | Exceptional 5.4% |
| Immigrants | Iran | 100.0 /100 | #29 | Exceptional 5.4% |
| Immigrants | Turkey | 100.0 /100 | #30 | Exceptional 5.4% |
| Immigrants | Venezuela | 100.0 /100 | #31 | Exceptional 5.4% |
| Immigrants | Australia | 100.0 /100 | #32 | Exceptional 5.5% |
| Immigrants | Pakistan | 100.0 /100 | #33 | Exceptional 5.5% |
| Immigrants | Asia | 100.0 /100 | #34 | Exceptional 5.5% |
| Afghans | 100.0 /100 | #35 | Exceptional 5.5% |
| Immigrants | Malaysia | 100.0 /100 | #36 | Exceptional 5.5% |
| Turks | 100.0 /100 | #37 | Exceptional 5.5% |
| Cypriots | 100.0 /100 | #38 | Exceptional 5.5% |
Demographics Similar to Croatians by Ambulatory Disability
In terms of ambulatory disability, the demographic groups most similar to Croatians are Immigrants from Burma/Myanmar (6.1%, a difference of 0.050%), Immigrants from Canada (6.1%, a difference of 0.060%), Moroccan (6.1%, a difference of 0.080%), Immigrants from Ecuador (6.1%, a difference of 0.14%), and Vietnamese (6.1%, a difference of 0.21%).
| Demographics | Rating | Rank | Ambulatory Disability |
| Iraqis | 62.8 /100 | #166 | Good 6.1% |
| Immigrants | Oceania | 60.7 /100 | #167 | Good 6.1% |
| Ecuadorians | 60.5 /100 | #168 | Good 6.1% |
| Immigrants | Southern Europe | 58.1 /100 | #169 | Average 6.1% |
| Immigrants | Ecuador | 53.8 /100 | #170 | Average 6.1% |
| Moroccans | 52.6 /100 | #171 | Average 6.1% |
| Immigrants | Burma/Myanmar | 52.2 /100 | #172 | Average 6.1% |
| Croatians | 51.2 /100 | #173 | Average 6.1% |
| Immigrants | Canada | 50.0 /100 | #174 | Average 6.1% |
| Vietnamese | 47.2 /100 | #175 | Average 6.1% |
| Immigrants | North America | 45.6 /100 | #176 | Average 6.1% |
| Immigrants | England | 45.4 /100 | #177 | Average 6.1% |
| Scandinavians | 44.5 /100 | #178 | Average 6.1% |
| Austrians | 44.1 /100 | #179 | Average 6.1% |
| Immigrants | Nicaragua | 43.9 /100 | #180 | Average 6.1% |