Immigrants from Venezuela vs Dominican 10th Grade
COMPARE
Immigrants from Venezuela
Dominican
10th Grade
10th Grade Comparison
Immigrants from Venezuela
Dominicans
93.8%
10TH GRADE
53.9/ 100
METRIC RATING
170th/ 347
METRIC RANK
89.4%
10TH GRADE
0.0/ 100
METRIC RATING
329th/ 347
METRIC RANK
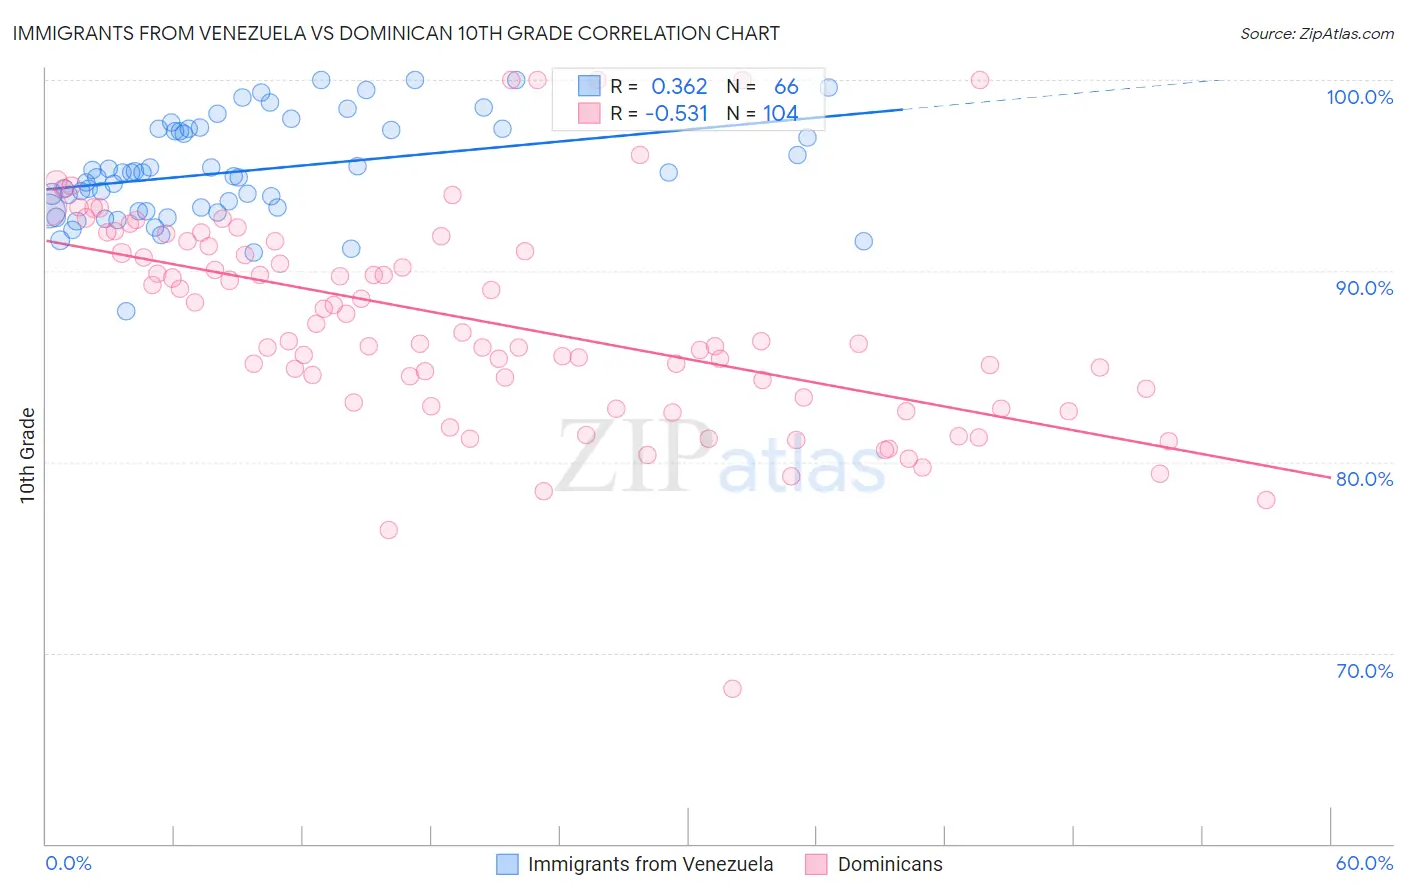
Immigrants from Venezuela vs Dominican 10th Grade Correlation Chart
The statistical analysis conducted on geographies consisting of 287,866,258 people shows a mild positive correlation between the proportion of Immigrants from Venezuela and percentage of population with at least 10th grade education in the United States with a correlation coefficient (R) of 0.362 and weighted average of 93.8%. Similarly, the statistical analysis conducted on geographies consisting of 355,142,452 people shows a substantial negative correlation between the proportion of Dominicans and percentage of population with at least 10th grade education in the United States with a correlation coefficient (R) of -0.531 and weighted average of 89.4%, a difference of 4.9%.
10th Grade Correlation Summary
| Measurement | Immigrants from Venezuela | Dominican |
| Minimum | 87.9% | 68.1% |
| Maximum | 100.0% | 100.0% |
| Range | 12.1% | 31.9% |
| Mean | 95.2% | 87.3% |
| Median | 95.1% | 86.3% |
| Interquartile 25% (IQ1) | 93.1% | 83.2% |
| Interquartile 75% (IQ3) | 97.4% | 91.4% |
| Interquartile Range (IQR) | 4.3% | 8.2% |
| Standard Deviation (Sample) | 2.6% | 5.6% |
| Standard Deviation (Population) | 2.6% | 5.6% |
Similar Demographics by 10th Grade
Demographics Similar to Immigrants from Venezuela by 10th Grade
In terms of 10th grade, the demographic groups most similar to Immigrants from Venezuela are Immigrants from Albania (93.8%, a difference of 0.010%), Immigrants from Spain (93.8%, a difference of 0.020%), French American Indian (93.7%, a difference of 0.030%), Spaniard (93.7%, a difference of 0.030%), and Argentinean (93.7%, a difference of 0.030%).
| Demographics | Rating | Rank | 10th Grade |
| Venezuelans | 69.5 /100 | #163 | Good 93.9% |
| Iraqis | 68.1 /100 | #164 | Good 93.9% |
| Brazilians | 63.6 /100 | #165 | Good 93.8% |
| Immigrants | Iraq | 63.0 /100 | #166 | Good 93.8% |
| Immigrants | Egypt | 62.3 /100 | #167 | Good 93.8% |
| Alsatians | 59.4 /100 | #168 | Average 93.8% |
| Immigrants | Spain | 55.9 /100 | #169 | Average 93.8% |
| Immigrants | Venezuela | 53.9 /100 | #170 | Average 93.8% |
| Immigrants | Albania | 52.4 /100 | #171 | Average 93.8% |
| French American Indians | 50.9 /100 | #172 | Average 93.7% |
| Spaniards | 50.3 /100 | #173 | Average 93.7% |
| Argentineans | 50.0 /100 | #174 | Average 93.7% |
| Immigrants | Nepal | 49.6 /100 | #175 | Average 93.7% |
| Immigrants | Argentina | 47.1 /100 | #176 | Average 93.7% |
| Immigrants | Lebanon | 47.1 /100 | #177 | Average 93.7% |
Demographics Similar to Dominicans by 10th Grade
In terms of 10th grade, the demographic groups most similar to Dominicans are Immigrants from Cabo Verde (89.5%, a difference of 0.10%), Immigrants from Nicaragua (89.5%, a difference of 0.11%), Immigrants from Yemen (89.1%, a difference of 0.35%), Central American Indian (89.7%, a difference of 0.37%), and Mexican American Indian (89.0%, a difference of 0.38%).
| Demographics | Rating | Rank | 10th Grade |
| Tohono O'odham | 0.0 /100 | #322 | Tragic 90.1% |
| Immigrants | Belize | 0.0 /100 | #323 | Tragic 90.1% |
| Immigrants | Armenia | 0.0 /100 | #324 | Tragic 89.9% |
| Puerto Ricans | 0.0 /100 | #325 | Tragic 89.8% |
| Central American Indians | 0.0 /100 | #326 | Tragic 89.7% |
| Immigrants | Nicaragua | 0.0 /100 | #327 | Tragic 89.5% |
| Immigrants | Cabo Verde | 0.0 /100 | #328 | Tragic 89.5% |
| Dominicans | 0.0 /100 | #329 | Tragic 89.4% |
| Immigrants | Yemen | 0.0 /100 | #330 | Tragic 89.1% |
| Mexican American Indians | 0.0 /100 | #331 | Tragic 89.0% |
| Immigrants | Azores | 0.0 /100 | #332 | Tragic 89.0% |
| Hondurans | 0.0 /100 | #333 | Tragic 89.0% |
| Hispanics or Latinos | 0.0 /100 | #334 | Tragic 88.9% |
| Immigrants | Dominican Republic | 0.0 /100 | #335 | Tragic 88.7% |
| Immigrants | Honduras | 0.0 /100 | #336 | Tragic 88.5% |