Immigrants from Uzbekistan vs Pennsylvania German Cognitive Disability
COMPARE
Immigrants from Uzbekistan
Pennsylvania German
Cognitive Disability
Cognitive Disability Comparison
Immigrants from Uzbekistan
Pennsylvania Germans
16.7%
COGNITIVE DISABILITY
99.4/ 100
METRIC RATING
69th/ 347
METRIC RANK
16.6%
COGNITIVE DISABILITY
99.7/ 100
METRIC RATING
58th/ 347
METRIC RANK
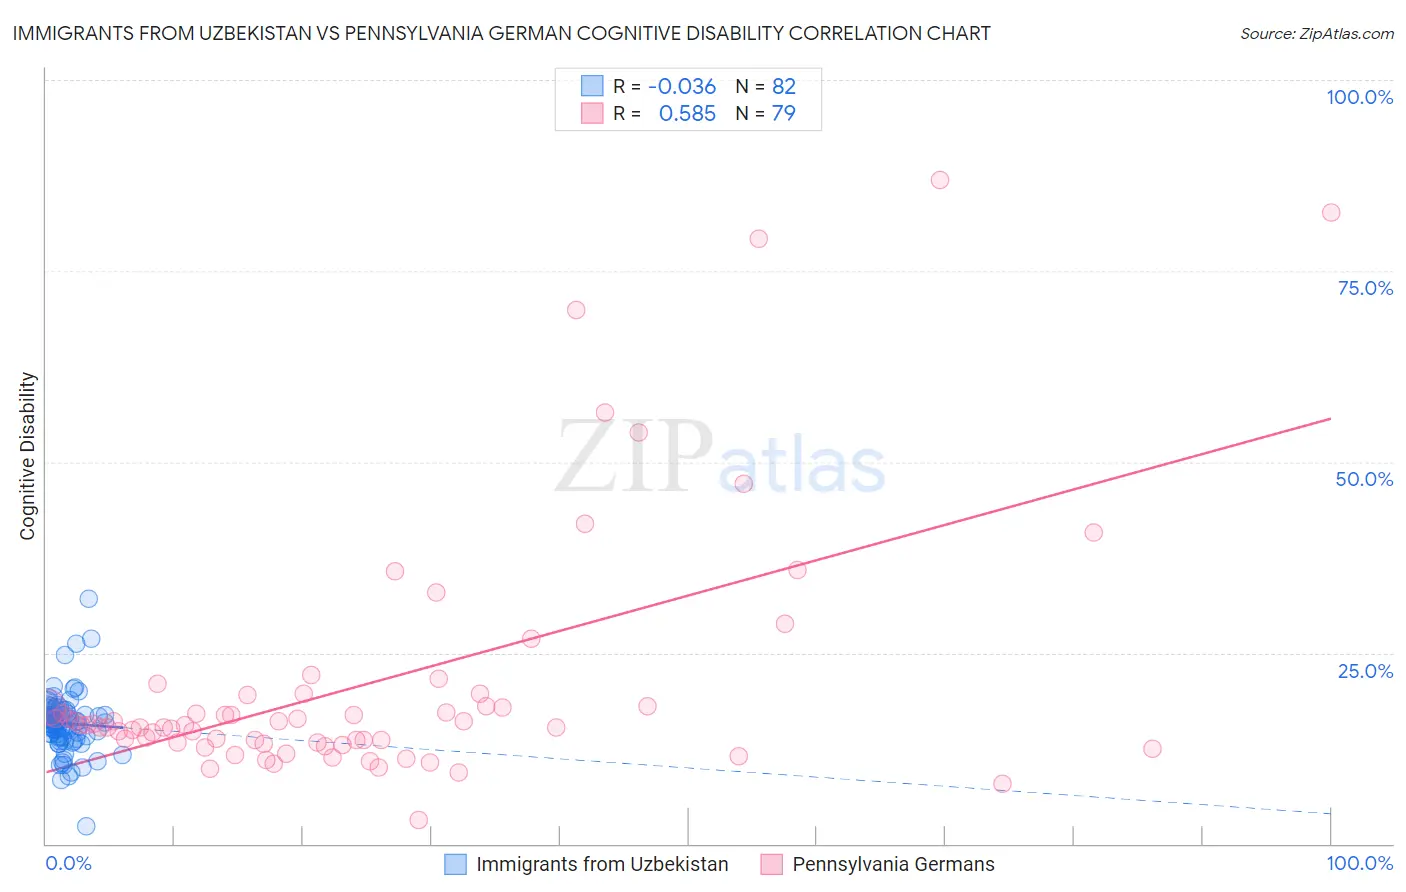
Immigrants from Uzbekistan vs Pennsylvania German Cognitive Disability Correlation Chart
The statistical analysis conducted on geographies consisting of 118,751,620 people shows no correlation between the proportion of Immigrants from Uzbekistan and percentage of population with cognitive disability in the United States with a correlation coefficient (R) of -0.036 and weighted average of 16.7%. Similarly, the statistical analysis conducted on geographies consisting of 234,106,123 people shows a substantial positive correlation between the proportion of Pennsylvania Germans and percentage of population with cognitive disability in the United States with a correlation coefficient (R) of 0.585 and weighted average of 16.6%, a difference of 0.48%.
Cognitive Disability Correlation Summary
| Measurement | Immigrants from Uzbekistan | Pennsylvania German |
| Minimum | 2.3% | 3.1% |
| Maximum | 32.0% | 87.0% |
| Range | 29.7% | 83.8% |
| Mean | 15.7% | 21.1% |
| Median | 15.7% | 15.5% |
| Interquartile 25% (IQ1) | 13.9% | 13.2% |
| Interquartile 75% (IQ3) | 17.6% | 19.5% |
| Interquartile Range (IQR) | 3.7% | 6.3% |
| Standard Deviation (Sample) | 4.1% | 16.7% |
| Standard Deviation (Population) | 4.0% | 16.6% |
Demographics Similar to Immigrants from Uzbekistan and Pennsylvania Germans by Cognitive Disability
In terms of cognitive disability, the demographic groups most similar to Immigrants from Uzbekistan are Immigrants from Sweden (16.7%, a difference of 0.010%), Immigrants from Belgium (16.7%, a difference of 0.020%), German (16.7%, a difference of 0.040%), Burmese (16.7%, a difference of 0.040%), and Ukrainian (16.6%, a difference of 0.080%). Similarly, the demographic groups most similar to Pennsylvania Germans are Immigrants from Peru (16.6%, a difference of 0.0%), Romanian (16.6%, a difference of 0.010%), Immigrants from England (16.6%, a difference of 0.070%), Austrian (16.6%, a difference of 0.080%), and Bhutanese (16.6%, a difference of 0.080%).
| Demographics | Rating | Rank | Cognitive Disability |
| Swedes | 99.8 /100 | #53 | Exceptional 16.5% |
| Immigrants | Iran | 99.8 /100 | #54 | Exceptional 16.5% |
| Immigrants | Venezuela | 99.7 /100 | #55 | Exceptional 16.5% |
| Austrians | 99.7 /100 | #56 | Exceptional 16.6% |
| Bhutanese | 99.7 /100 | #57 | Exceptional 16.6% |
| Pennsylvania Germans | 99.7 /100 | #58 | Exceptional 16.6% |
| Immigrants | Peru | 99.7 /100 | #59 | Exceptional 16.6% |
| Romanians | 99.7 /100 | #60 | Exceptional 16.6% |
| Immigrants | England | 99.6 /100 | #61 | Exceptional 16.6% |
| Czechoslovakians | 99.6 /100 | #62 | Exceptional 16.6% |
| Argentineans | 99.6 /100 | #63 | Exceptional 16.6% |
| Venezuelans | 99.6 /100 | #64 | Exceptional 16.6% |
| Colombians | 99.6 /100 | #65 | Exceptional 16.6% |
| Immigrants | Ukraine | 99.5 /100 | #66 | Exceptional 16.6% |
| Latvians | 99.5 /100 | #67 | Exceptional 16.6% |
| Ukrainians | 99.4 /100 | #68 | Exceptional 16.6% |
| Immigrants | Uzbekistan | 99.4 /100 | #69 | Exceptional 16.7% |
| Immigrants | Sweden | 99.4 /100 | #70 | Exceptional 16.7% |
| Immigrants | Belgium | 99.3 /100 | #71 | Exceptional 16.7% |
| Germans | 99.3 /100 | #72 | Exceptional 16.7% |
| Burmese | 99.3 /100 | #73 | Exceptional 16.7% |