Korean vs Japanese Disability Age Over 75
COMPARE
Korean
Japanese
Disability Age Over 75
Disability Age Over 75 Comparison
Koreans
Japanese
48.6%
DISABILITY AGE OVER 75
0.8/ 100
METRIC RATING
251st/ 347
METRIC RANK
50.2%
DISABILITY AGE OVER 75
0.0/ 100
METRIC RATING
303rd/ 347
METRIC RANK
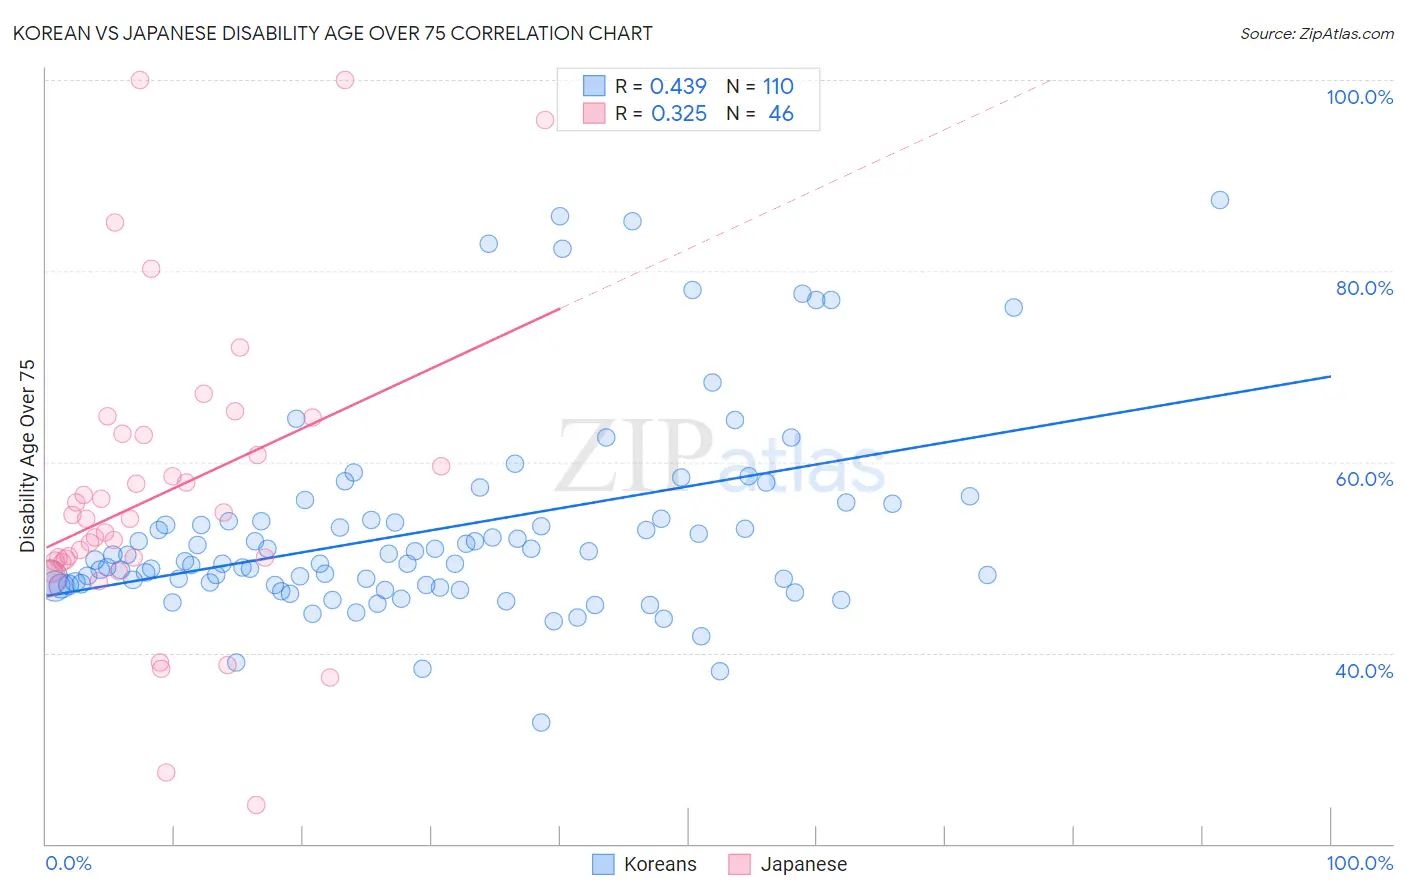
Korean vs Japanese Disability Age Over 75 Correlation Chart
The statistical analysis conducted on geographies consisting of 509,359,043 people shows a moderate positive correlation between the proportion of Koreans and percentage of population with a disability over the age of 75 in the United States with a correlation coefficient (R) of 0.439 and weighted average of 48.6%. Similarly, the statistical analysis conducted on geographies consisting of 248,861,887 people shows a mild positive correlation between the proportion of Japanese and percentage of population with a disability over the age of 75 in the United States with a correlation coefficient (R) of 0.325 and weighted average of 50.2%, a difference of 3.3%.
Disability Age Over 75 Correlation Summary
| Measurement | Korean | Japanese |
| Minimum | 32.7% | 24.0% |
| Maximum | 87.4% | 100.0% |
| Range | 54.7% | 76.0% |
| Mean | 52.9% | 56.6% |
| Median | 49.6% | 54.0% |
| Interquartile 25% (IQ1) | 47.1% | 49.6% |
| Interquartile 75% (IQ3) | 53.9% | 62.8% |
| Interquartile Range (IQR) | 6.9% | 13.3% |
| Standard Deviation (Sample) | 10.5% | 15.9% |
| Standard Deviation (Population) | 10.4% | 15.7% |
Similar Demographics by Disability Age Over 75
Demographics Similar to Koreans by Disability Age Over 75
In terms of disability age over 75, the demographic groups most similar to Koreans are West Indian (48.6%, a difference of 0.020%), Iraqi (48.6%, a difference of 0.10%), Immigrants from South Eastern Asia (48.7%, a difference of 0.10%), British West Indian (48.7%, a difference of 0.15%), and Immigrants from Vietnam (48.7%, a difference of 0.18%).
| Demographics | Rating | Rank | Disability Age Over 75 |
| Afghans | 1.8 /100 | #244 | Tragic 48.4% |
| Americans | 1.7 /100 | #245 | Tragic 48.4% |
| Chippewa | 1.6 /100 | #246 | Tragic 48.4% |
| Iroquois | 1.6 /100 | #247 | Tragic 48.4% |
| Sri Lankans | 1.4 /100 | #248 | Tragic 48.5% |
| Iraqis | 1.0 /100 | #249 | Tragic 48.6% |
| West Indians | 0.8 /100 | #250 | Tragic 48.6% |
| Koreans | 0.8 /100 | #251 | Tragic 48.6% |
| Immigrants | South Eastern Asia | 0.7 /100 | #252 | Tragic 48.7% |
| British West Indians | 0.6 /100 | #253 | Tragic 48.7% |
| Immigrants | Vietnam | 0.6 /100 | #254 | Tragic 48.7% |
| Chinese | 0.5 /100 | #255 | Tragic 48.7% |
| Immigrants | Congo | 0.5 /100 | #256 | Tragic 48.7% |
| Blackfeet | 0.5 /100 | #257 | Tragic 48.8% |
| Immigrants | Philippines | 0.4 /100 | #258 | Tragic 48.8% |
Demographics Similar to Japanese by Disability Age Over 75
In terms of disability age over 75, the demographic groups most similar to Japanese are Cherokee (50.2%, a difference of 0.010%), Immigrants from Dominican Republic (50.3%, a difference of 0.11%), Dominican (50.2%, a difference of 0.17%), Cape Verdean (50.1%, a difference of 0.23%), and Immigrants from Micronesia (50.1%, a difference of 0.26%).
| Demographics | Rating | Rank | Disability Age Over 75 |
| Mexican American Indians | 0.0 /100 | #296 | Tragic 50.0% |
| Armenians | 0.0 /100 | #297 | Tragic 50.0% |
| Marshallese | 0.0 /100 | #298 | Tragic 50.1% |
| Immigrants | Micronesia | 0.0 /100 | #299 | Tragic 50.1% |
| Cape Verdeans | 0.0 /100 | #300 | Tragic 50.1% |
| Dominicans | 0.0 /100 | #301 | Tragic 50.2% |
| Cherokee | 0.0 /100 | #302 | Tragic 50.2% |
| Japanese | 0.0 /100 | #303 | Tragic 50.2% |
| Immigrants | Dominican Republic | 0.0 /100 | #304 | Tragic 50.3% |
| Central American Indians | 0.0 /100 | #305 | Tragic 50.5% |
| Immigrants | Central America | 0.0 /100 | #306 | Tragic 50.5% |
| Immigrants | Fiji | 0.0 /100 | #307 | Tragic 50.6% |
| Hispanics or Latinos | 0.0 /100 | #308 | Tragic 50.6% |
| Aleuts | 0.0 /100 | #309 | Tragic 50.6% |
| Tlingit-Haida | 0.0 /100 | #310 | Tragic 50.6% |