Immigrants from Uruguay vs Immigrants from Norway Disability Age 65 to 74
COMPARE
Immigrants from Uruguay
Immigrants from Norway
Disability Age 65 to 74
Disability Age 65 to 74 Comparison
Immigrants from Uruguay
Immigrants from Norway
22.6%
DISABILITY AGE 65 TO 74
90.1/ 100
METRIC RATING
129th/ 347
METRIC RANK
21.8%
DISABILITY AGE 65 TO 74
98.9/ 100
METRIC RATING
80th/ 347
METRIC RANK
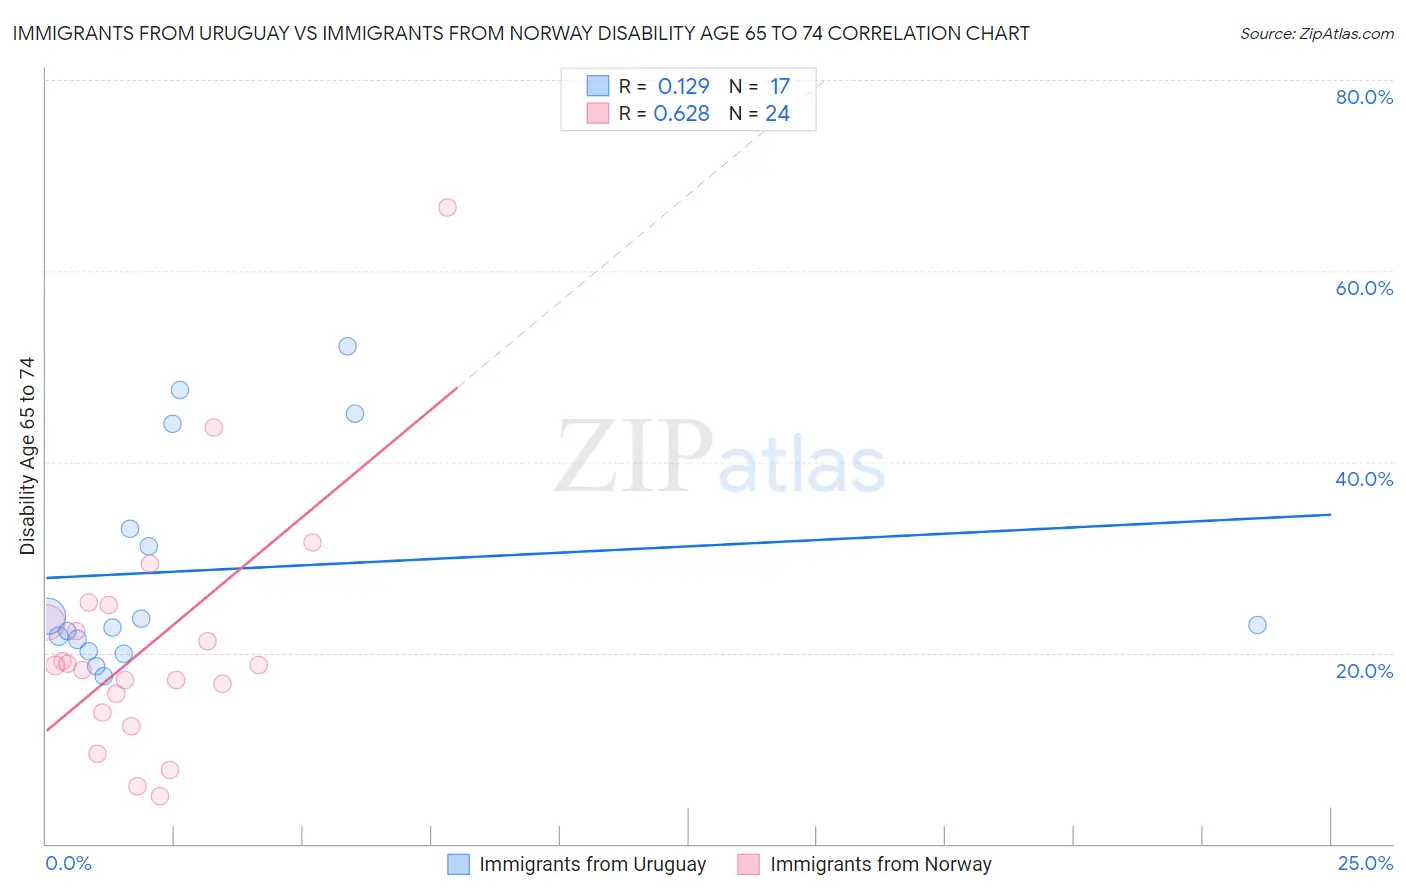
Immigrants from Uruguay vs Immigrants from Norway Disability Age 65 to 74 Correlation Chart
The statistical analysis conducted on geographies consisting of 133,228,680 people shows a poor positive correlation between the proportion of Immigrants from Uruguay and percentage of population with a disability between the ages 65 and 75 in the United States with a correlation coefficient (R) of 0.129 and weighted average of 22.6%. Similarly, the statistical analysis conducted on geographies consisting of 116,625,625 people shows a significant positive correlation between the proportion of Immigrants from Norway and percentage of population with a disability between the ages 65 and 75 in the United States with a correlation coefficient (R) of 0.628 and weighted average of 21.8%, a difference of 3.6%.
Disability Age 65 to 74 Correlation Summary
| Measurement | Immigrants from Uruguay | Immigrants from Norway |
| Minimum | 17.5% | 5.0% |
| Maximum | 52.1% | 66.7% |
| Range | 34.6% | 61.6% |
| Mean | 28.7% | 20.9% |
| Median | 22.9% | 18.7% |
| Interquartile 25% (IQ1) | 20.8% | 14.7% |
| Interquartile 75% (IQ3) | 38.5% | 24.1% |
| Interquartile Range (IQR) | 17.7% | 9.4% |
| Standard Deviation (Sample) | 11.4% | 12.9% |
| Standard Deviation (Population) | 11.0% | 12.6% |
Similar Demographics by Disability Age 65 to 74
Demographics Similar to Immigrants from Uruguay by Disability Age 65 to 74
In terms of disability age 65 to 74, the demographic groups most similar to Immigrants from Uruguay are Immigrants from Albania (22.6%, a difference of 0.010%), Immigrants from Costa Rica (22.6%, a difference of 0.060%), Immigrants from Nepal (22.6%, a difference of 0.10%), Costa Rican (22.6%, a difference of 0.14%), and Northern European (22.6%, a difference of 0.18%).
| Demographics | Rating | Rank | Disability Age 65 to 74 |
| Immigrants | Jordan | 93.5 /100 | #122 | Exceptional 22.4% |
| Hungarians | 93.3 /100 | #123 | Exceptional 22.4% |
| Norwegians | 92.5 /100 | #124 | Exceptional 22.5% |
| Immigrants | Western Europe | 92.3 /100 | #125 | Exceptional 22.5% |
| Lebanese | 92.2 /100 | #126 | Exceptional 22.5% |
| Slovaks | 91.6 /100 | #127 | Exceptional 22.5% |
| Immigrants | Costa Rica | 90.4 /100 | #128 | Exceptional 22.6% |
| Immigrants | Uruguay | 90.1 /100 | #129 | Exceptional 22.6% |
| Immigrants | Albania | 90.0 /100 | #130 | Excellent 22.6% |
| Immigrants | Nepal | 89.4 /100 | #131 | Excellent 22.6% |
| Costa Ricans | 89.2 /100 | #132 | Excellent 22.6% |
| Northern Europeans | 88.9 /100 | #133 | Excellent 22.6% |
| Afghans | 88.6 /100 | #134 | Excellent 22.6% |
| Immigrants | Ukraine | 88.4 /100 | #135 | Excellent 22.6% |
| Ethiopians | 87.9 /100 | #136 | Excellent 22.7% |
Demographics Similar to Immigrants from Norway by Disability Age 65 to 74
In terms of disability age 65 to 74, the demographic groups most similar to Immigrants from Norway are Venezuelan (21.8%, a difference of 0.010%), Immigrants from Eastern Europe (21.8%, a difference of 0.020%), Immigrants from Poland (21.8%, a difference of 0.070%), Croatian (21.8%, a difference of 0.070%), and Greek (21.8%, a difference of 0.13%).
| Demographics | Rating | Rank | Disability Age 65 to 74 |
| Immigrants | Venezuela | 99.0 /100 | #73 | Exceptional 21.8% |
| Cambodians | 99.0 /100 | #74 | Exceptional 21.8% |
| Mongolians | 99.0 /100 | #75 | Exceptional 21.8% |
| Greeks | 99.0 /100 | #76 | Exceptional 21.8% |
| Immigrants | Poland | 99.0 /100 | #77 | Exceptional 21.8% |
| Immigrants | Eastern Europe | 99.0 /100 | #78 | Exceptional 21.8% |
| Venezuelans | 99.0 /100 | #79 | Exceptional 21.8% |
| Immigrants | Norway | 98.9 /100 | #80 | Exceptional 21.8% |
| Croatians | 98.9 /100 | #81 | Exceptional 21.8% |
| Immigrants | Indonesia | 98.7 /100 | #82 | Exceptional 21.9% |
| Immigrants | Brazil | 98.5 /100 | #83 | Exceptional 21.9% |
| Immigrants | Spain | 98.5 /100 | #84 | Exceptional 21.9% |
| Immigrants | Lebanon | 98.4 /100 | #85 | Exceptional 21.9% |
| South Africans | 98.4 /100 | #86 | Exceptional 21.9% |
| Australians | 98.0 /100 | #87 | Exceptional 22.0% |