Immigrants from Ukraine vs Tongan Ambulatory Disability
COMPARE
Immigrants from Ukraine
Tongan
Ambulatory Disability
Ambulatory Disability Comparison
Immigrants from Ukraine
Tongans
6.2%
AMBULATORY DISABILITY
18.4/ 100
METRIC RATING
203rd/ 347
METRIC RANK
5.4%
AMBULATORY DISABILITY
100.0/ 100
METRIC RATING
23rd/ 347
METRIC RANK
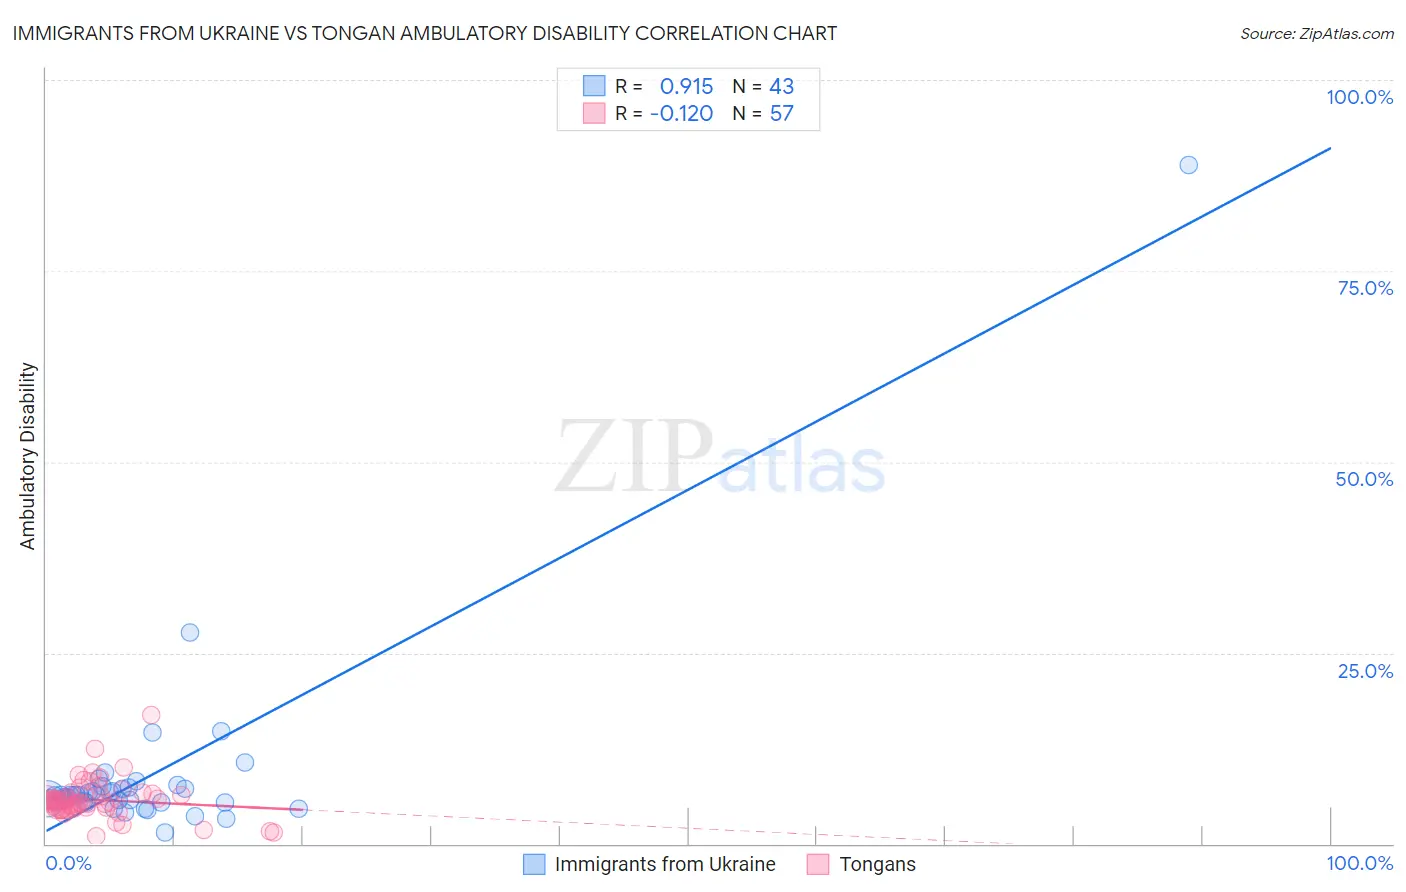
Immigrants from Ukraine vs Tongan Ambulatory Disability Correlation Chart
The statistical analysis conducted on geographies consisting of 289,659,329 people shows a near-perfect positive correlation between the proportion of Immigrants from Ukraine and percentage of population with ambulatory disability in the United States with a correlation coefficient (R) of 0.915 and weighted average of 6.2%. Similarly, the statistical analysis conducted on geographies consisting of 102,876,651 people shows a poor negative correlation between the proportion of Tongans and percentage of population with ambulatory disability in the United States with a correlation coefficient (R) of -0.120 and weighted average of 5.4%, a difference of 15.9%.
Ambulatory Disability Correlation Summary
| Measurement | Immigrants from Ukraine | Tongan |
| Minimum | 1.5% | 0.94% |
| Maximum | 88.9% | 16.9% |
| Range | 87.4% | 16.0% |
| Mean | 8.9% | 5.8% |
| Median | 6.3% | 5.4% |
| Interquartile 25% (IQ1) | 5.5% | 4.5% |
| Interquartile 75% (IQ3) | 7.3% | 6.5% |
| Interquartile Range (IQR) | 1.9% | 1.9% |
| Standard Deviation (Sample) | 13.1% | 2.5% |
| Standard Deviation (Population) | 13.0% | 2.5% |
Similar Demographics by Ambulatory Disability
Demographics Similar to Immigrants from Ukraine by Ambulatory Disability
In terms of ambulatory disability, the demographic groups most similar to Immigrants from Ukraine are Immigrants from Congo (6.2%, a difference of 0.010%), Slovene (6.2%, a difference of 0.030%), Finnish (6.2%, a difference of 0.10%), Albanian (6.2%, a difference of 0.11%), and Immigrants from Central America (6.2%, a difference of 0.14%).
| Demographics | Rating | Rank | Ambulatory Disability |
| Malaysians | 28.2 /100 | #196 | Fair 6.2% |
| Poles | 26.3 /100 | #197 | Fair 6.2% |
| Immigrants | Bangladesh | 24.6 /100 | #198 | Fair 6.2% |
| Italians | 22.6 /100 | #199 | Fair 6.2% |
| Immigrants | Cambodia | 21.5 /100 | #200 | Fair 6.2% |
| Immigrants | Central America | 20.1 /100 | #201 | Fair 6.2% |
| Albanians | 19.7 /100 | #202 | Poor 6.2% |
| Immigrants | Ukraine | 18.4 /100 | #203 | Poor 6.2% |
| Immigrants | Congo | 18.2 /100 | #204 | Poor 6.2% |
| Slovenes | 18.0 /100 | #205 | Poor 6.2% |
| Finns | 17.2 /100 | #206 | Poor 6.2% |
| Alsatians | 15.1 /100 | #207 | Poor 6.3% |
| Bangladeshis | 14.2 /100 | #208 | Poor 6.3% |
| Immigrants | Iraq | 14.0 /100 | #209 | Poor 6.3% |
| Immigrants | Laos | 13.2 /100 | #210 | Poor 6.3% |
Demographics Similar to Tongans by Ambulatory Disability
In terms of ambulatory disability, the demographic groups most similar to Tongans are Immigrants from Israel (5.4%, a difference of 0.040%), Immigrants from Saudi Arabia (5.4%, a difference of 0.090%), Zimbabwean (5.4%, a difference of 0.17%), Immigrants from Nepal (5.4%, a difference of 0.20%), and Asian (5.4%, a difference of 0.36%).
| Demographics | Rating | Rank | Ambulatory Disability |
| Immigrants | Hong Kong | 100.0 /100 | #16 | Exceptional 5.3% |
| Immigrants | Ethiopia | 100.0 /100 | #17 | Exceptional 5.4% |
| Immigrants | Sri Lanka | 100.0 /100 | #18 | Exceptional 5.4% |
| Indians (Asian) | 100.0 /100 | #19 | Exceptional 5.4% |
| Ethiopians | 100.0 /100 | #20 | Exceptional 5.4% |
| Immigrants | Kuwait | 100.0 /100 | #21 | Exceptional 5.4% |
| Immigrants | Israel | 100.0 /100 | #22 | Exceptional 5.4% |
| Tongans | 100.0 /100 | #23 | Exceptional 5.4% |
| Immigrants | Saudi Arabia | 100.0 /100 | #24 | Exceptional 5.4% |
| Zimbabweans | 100.0 /100 | #25 | Exceptional 5.4% |
| Immigrants | Nepal | 100.0 /100 | #26 | Exceptional 5.4% |
| Asians | 100.0 /100 | #27 | Exceptional 5.4% |
| Cambodians | 100.0 /100 | #28 | Exceptional 5.4% |
| Immigrants | Iran | 100.0 /100 | #29 | Exceptional 5.4% |
| Immigrants | Turkey | 100.0 /100 | #30 | Exceptional 5.4% |